EEM 76-day bearish forecast — Nov 1, 2026
- Bias: Bearish
- Timeframe: 76 days (made Nov 1, 2026, target date Jan 15, 2027)
- Price at analysis: $61.04
- Price target: $58.50
- Expected range: $53.50 – $65.50
- Result: Pending — graded after the close on Jan 15, 2027
Get a free AI analysis of EEM today
Analysis
TECHNICAL INDICATORS
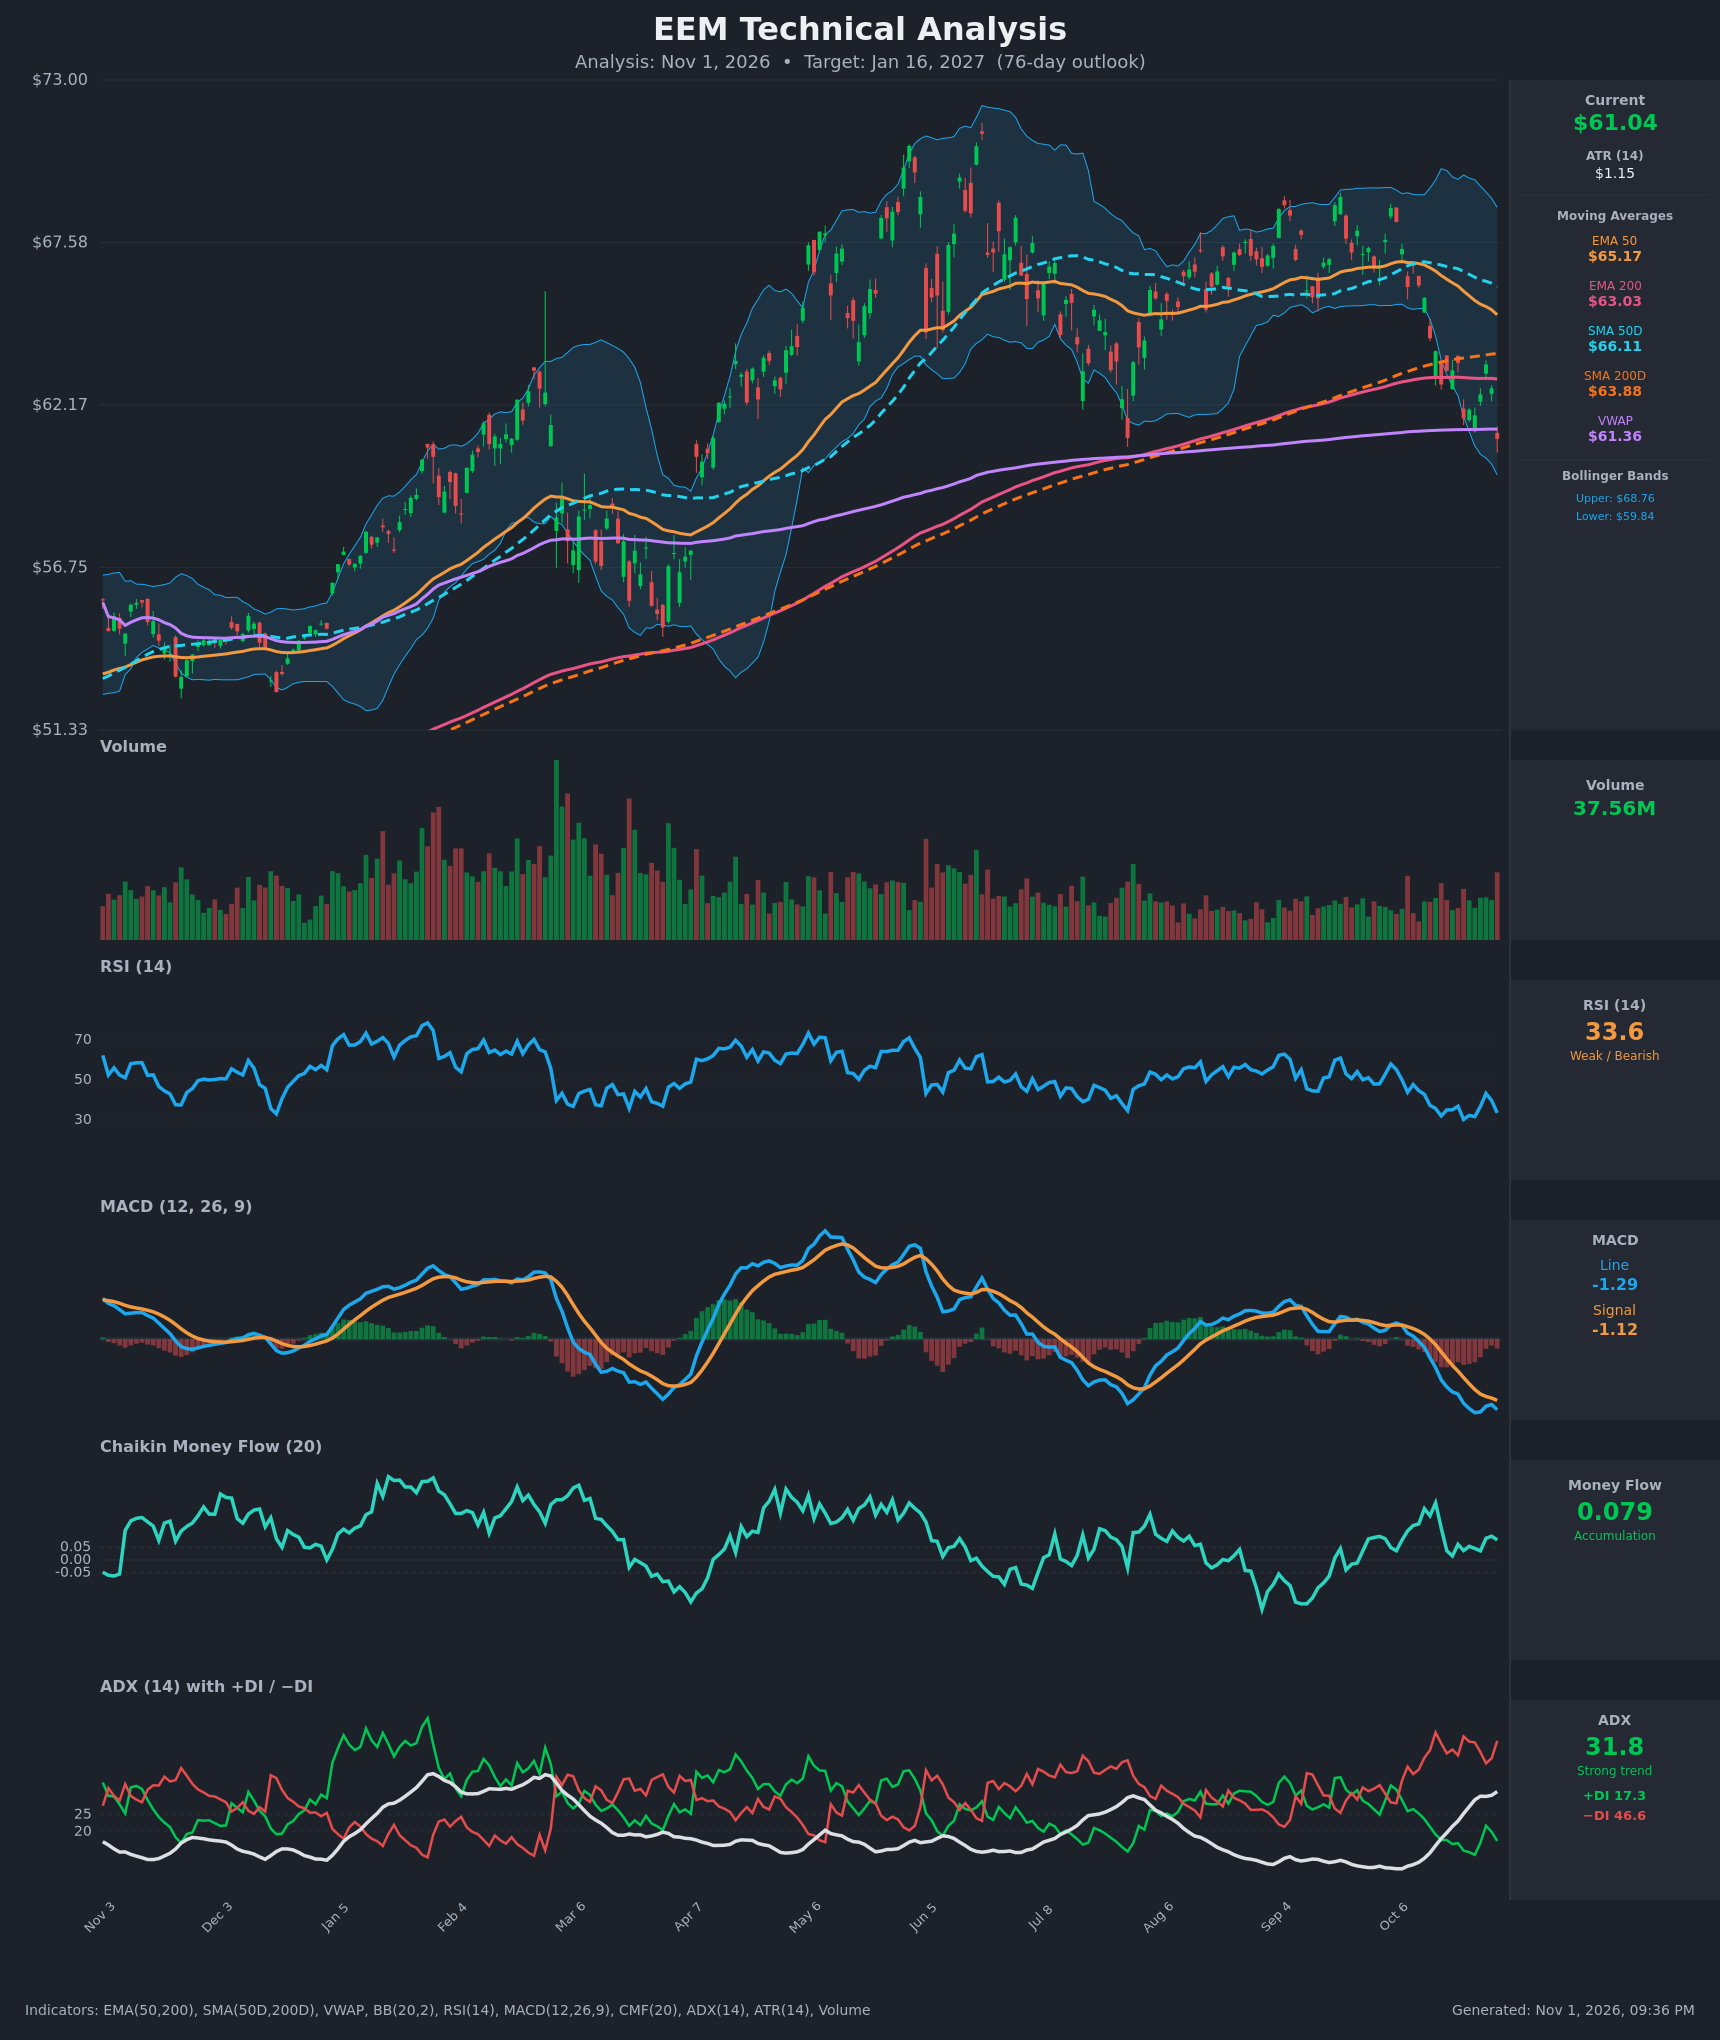
- RSI (14): 33.56, just above oversold. It bounced to 43 on Oct 28 and rolled over again. It has stayed below 50 for weeks with no bullish divergence yet. [Bearish]
- 20 EMA: No 20 EMA value was supplied, so I use the EMA 50 at $65.17 instead. Price at $61.04 is about 6% below it and also below the EMA 200 ($63.03). Both now act as overhead resistance. [Bearish]
- MACD: Line -1.286, signal -1.117, histogram about -0.17. The line crossed below the signal around Oct 15 and both sit deep below zero. The histogram narrowed on Oct 28-29 and then widened again, so momentum is still negative. [Bearish]
- Bollinger Bands (20): Upper $68.76, lower $59.84. Price at $61.04 is in the lower quarter of the bands, about $1.20 above the lower band. The bands are wide after the sell-off, so a walk down the lower band is possible, though a snap-back toward the midline is also possible. [Bearish]
- CMF (20): 0.079, above the +0.05 threshold, and positive throughout the decline. Buying pressure has held up despite the drop, which is the main bullish offset here. [Accumulation]
- ADX (14): 31.8 and rising from about 11 two weeks ago, so a strong trend is established. −DI at 46.6 is far above +DI at 17.3, so sellers control the trend. [Strong Trend – Bearish]
- Volume: 37.56M, near average, with no capitulation spike. The sell-off lacks the exhaustion volume that normally marks a durable low, and the latest bar is a red close at fresh lows. [Neutral-to-Bearish: no capitulation yet]
DIVERGENCES & TRENDS
- Moving averages: Price has lost the EMA 50, SMA 50D, EMA 200 and SMA 200D in about two weeks. The EMA 50 ($65.17) and SMA 50D ($66.11) are still above the 200s, so no death cross has formed. Both 50s are falling quickly and could cross below the 200s within the 76-day window.
- VWAP: Price is slightly below VWAP ($61.36), a mild sign of selling pressure.
- Indicator trends: MACD is making new lows. The RSI low of 30.3 (Oct 22) was followed by a higher low of 31.7 (Oct 26), but the current 33.6 is falling again and the divergence is unconfirmed.
- CMF vs. price: CMF is positive while price falls. This is a bullish divergence, though a weak one, and it needs price confirmation.
- Directional movement: The DI spread is large (−DI 46.6 vs +DI 17.3) and ADX has crossed above 25 with −DI dominant, a classic bearish trend-confirmation setup.
CHART PATTERNS
- Bearish Double/Triple Top: The June and September highs near $69 and the October highs near $68 form a rough multi-top. The neckline is the August low near $61.2, and price has now broken it. The measured move (about $7.8 of height) points toward the low $50s. I treat that as a stretched, low-probability target within 76 days, since price must first clear support near $59-60.
- Broken range: The June-October trading range (about $61-$69) has failed to the downside, so the old floor near $61.2-$63 becomes resistance.
- Bullish counter-scenario: The long-term trend since last November is still up and the 200-day averages are rising, so a pullback to $59-60 could form a higher low. A bullish reversal pattern would need a reclaim of $63-$64.
POTENTIAL SCENARIOS
- Scenario 1: Bearish Trend Continuation — The range breakdown extends, with price walking the lower Bollinger Band and the 50-day averages crossing below the 200s. Rallies stall at the VWAP/EMA 200 zone. Trigger: daily close below $59.84 (lower band). Target: $57.50-$58.50, with an extension to $55-$56.75 on a failed bounce. Invalidation: daily close above $64 (SMA 200D). (47% probability)
- Scenario 2: Bullish Oversold Rebound — RSI near 30 and positive CMF fuel a mean-reversion bounce back to the 200-day averages, where the pullback would be treated as a higher low. Trigger: reclaim of $63.03-$63.88 with MACD histogram turning positive. Target: $65-$66.5 (EMA 50/SMA 50D). Invalidation: close below $59. (33% probability)
- Scenario 3: Neutral Base Building — Price chops between roughly $58.50 and $64 as ADX fades and the sell-off exhausts. Trigger: failure to break either $59.84 or $63.88 for several weeks. Target: $60-$63. Invalidation: a daily close outside the $58.50-$64 band. (20% probability)
PRICE TARGETS
- Target Price: $58.50 (76-day horizon, Jan 16, 2027)
- Expected Range: $53.50 to $65.50. This is $12.00 wide, or about 19.7% of the current price, in line with the 18-30% guidance for 61-180 days. Roughly 1.5 ATR-scaled swings over a multi-week horizon justify this width.
- Key Levels: Support at $59.84 (lower Bollinger Band), then $56.75. Resistance at $63.03 (EMA 200), then $63.88 (SMA 200D).
OVERALL BIAS
OVERALL BIAS: BEARISH - Price has broken below all four major moving averages with a bearish MACD, ADX at 31.8 and −DI far above +DI, and a failed June-October range. Positive CMF and near-oversold RSI argue for volatile bounces, but they are not enough to override the trend over 76 days.
This is educational analysis and not financial advice.