GLD 76-day bearish forecast — Nov 1, 2026
- Bias: Bearish
- Timeframe: 76 days (made Nov 1, 2026, target date Jan 15, 2027)
- Price at analysis: $355.78
- Price target: $344.00
- Expected range: $318.00 – $388.00
- Result: Pending — graded after the close on Jan 15, 2027
Get a free AI analysis of GLD today
Analysis
TECHNICAL INDICATORS
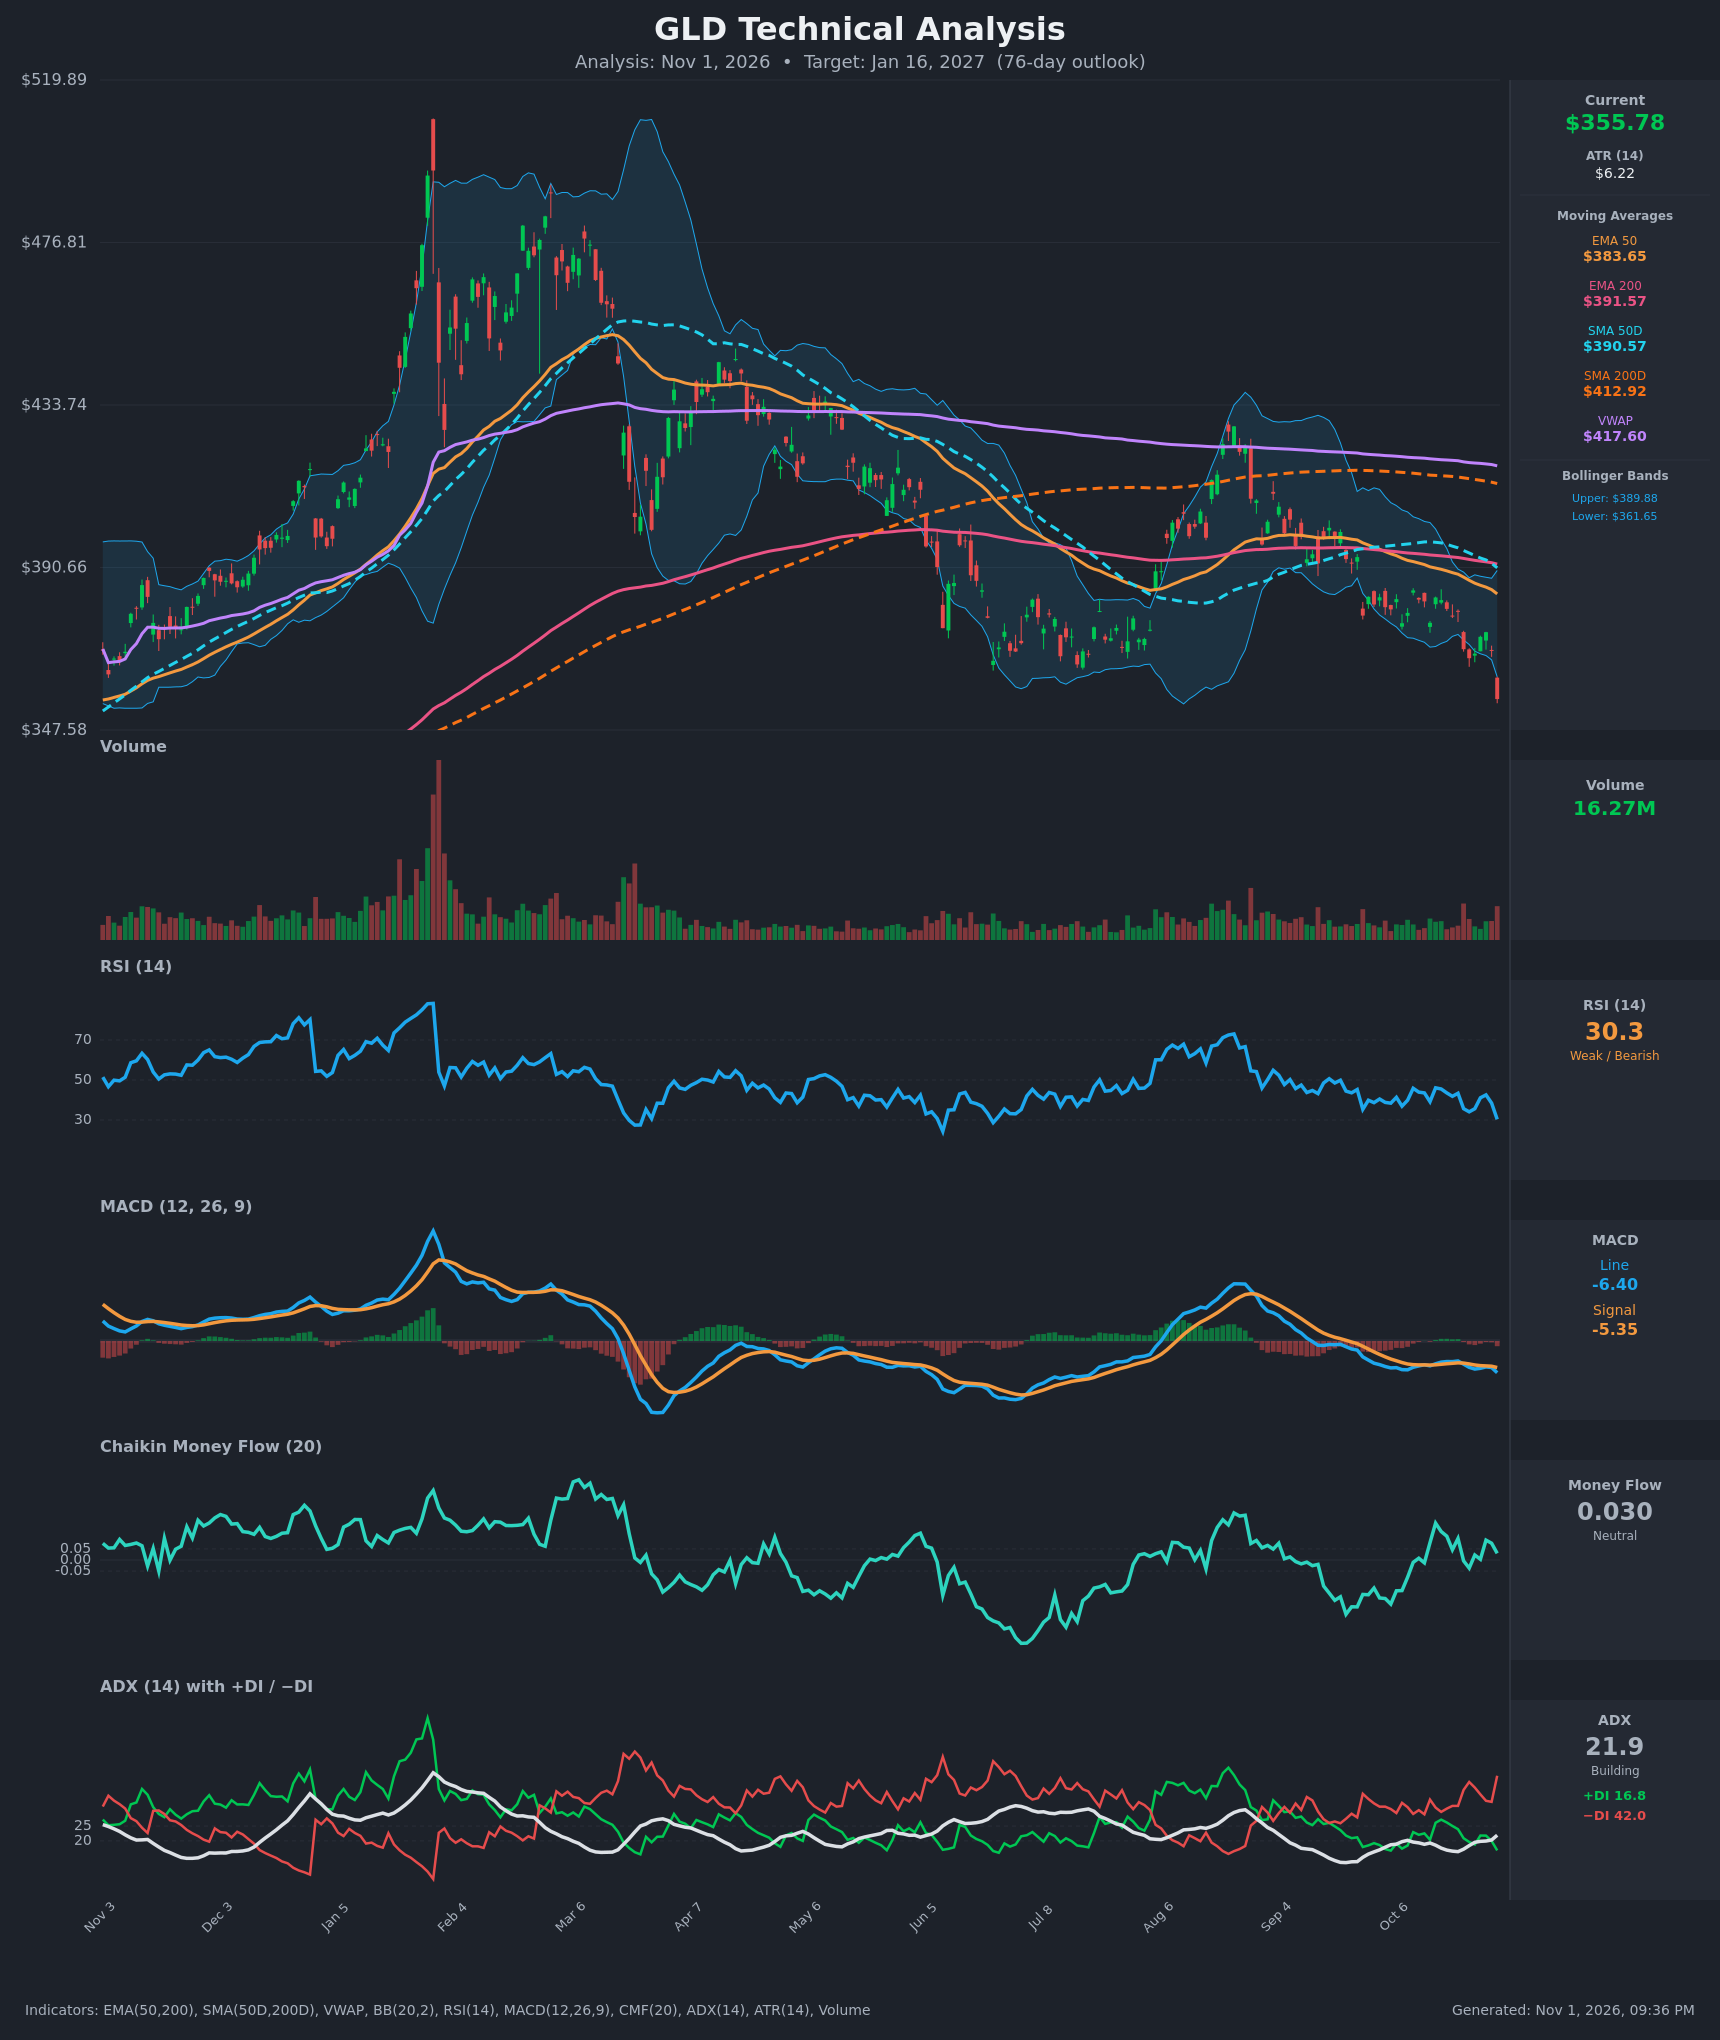
- RSI (14): 30.32, right at the oversold threshold and down from 42.6 on Oct 28. Momentum is falling sharply and has not yet turned up. Oversold readings can persist in a downtrend, and this one has no bullish divergence yet. [Bearish]
- 20 EMA: Not supplied. The 20-period Bollinger midline is roughly $375.8, and price at $355.78 is about 5% below it, so it acts as overhead resistance. The EMA50 ($383.65) and EMA200 ($391.57) are also well above price. [Bearish]
- MACD: Line -6.395 is below signal -5.347, a histogram of about -1.05 that is widening. The line is making a new low for the move after a brief flattening in late October, so downside momentum is re-accelerating. [Bearish]
- Bollinger Bands (20): Upper $389.88, lower $361.65, midline about $375.76. Price closed about $5.9 below the lower band, a band-walk or "break-out" close, with the bands starting to widen. This signals a momentum extension, though it is also stretched enough to allow a snap-back toward the $362–$376 zone. [Bearish]
- CMF (20): 0.030, between -0.05 and +0.05, so money flow is neutral. It has stayed flat to slightly positive during the decline, which means no heavy distribution yet. That is a mild cushion against a waterfall drop. [Neutral]
- ADX (14): 21.9 and rising, with −DI at 42.0 well above +DI at 16.8. A 25-point DI spread is a strong bearish dominance signal even though ADX is not yet above 25. The trend is firming in the bears' favour. [Weak-to-Building Trend, Bearish]
- Volume: 16.27M on the latest bar, which is above the recent average and comes on a large red candle. A breakdown on rising volume gives it credibility, though it could also be an early capitulation sign. [Bearish, confirming the breakdown]
DIVERGENCES & TRENDS
- No bullish divergence: RSI at 30.3 is above its Jun and Jul lows (~25–28) while price is making a new low. That relative RSI strength is not a divergence signal, because momentum is still falling.
- Moving-average structure is bearish: The SMA50D ($390.57) sits below the SMA200D ($412.92), a death cross already in place. The EMA50 is below the EMA200, and the SMA200D and VWAP ($417.60) are both falling. Price is below every average.
- MACD: It rolled over again and is below signal and zero. The Aug rally failed at the declining SMA200D, a lower high.
- DI: −DI has been above +DI almost continuously since the Feb peak, and the spread widened sharply on Oct 30 (+DI fell from 20.0 to 16.8, −DI rose from 33.2 to 42.0).
- CMF: Near zero and not confirming the selling, which hints that the decline lacks a heavy distribution phase. This is a minor counterpoint.
- Support break: Price has broken below the Jun–Oct range lows (~$365–$370) and the lower Bollinger Band.
CHART PATTERNS
- Bearish lower-high structure: The peaks run from about $519 (Jan–Feb) to about $440 (Aug) to about $405 (Sep), and the Jun–Jul lows near $365–$370 have now failed. This resembles the Bearish Head and Shoulders / Descending Triangle family, with a breakdown through a horizontal support "neckline" around $365–$370.
- Measured move: The consolidation was roughly $365–$405, a height of about $40. Projecting down from $365 gives about $325, which is the downside tail target.
- Counter-scenario: A false breakdown back into the range would revive a Bullish Double Bottom / range idea, but that needs a reclaim of $370+.
POTENTIAL SCENARIOS
- Scenario 1: Bearish Breakdown Continuation — Price stays below the broken Jun–Oct range support and the falling EMAs, and −DI dominance pushes ADX above 25. Rallies stall at $362–$375. Trigger: a daily close below $347–$350 or failed retests of $365–$370. Target: $340–$345, with an extension toward $325 (measured move). Invalidation: a daily close above $375 (the Bollinger midline) with MACD turning up. (45% probability)
- Scenario 2: Bullish Oversold Rebound — An RSI-30 and lower-band extension triggers mean reversion back into the old range. Trigger: a daily close back above $362 with RSI above 40 and a MACD histogram turn. Target: $370–$385 (the Bollinger midline and EMA50 area). Invalidation: a close below $347 or a rejection at $370. (40% probability)
- Scenario 3: Neutral Range Basing — Price chops sideways in a new $340–$372 base as the selling eases and CMF stays near zero. Trigger: low-volume consolidation holding $345. Target: $355–$365. Invalidation: a close outside $338 or $375. (15% probability)
PRICE TARGETS
For the 76-day timeframe (about Jan 16, 2027):
- Target Price: $344.00
- Expected Range: $318.00 to $388.00 (width $70, about 19.7% of the current price, consistent with the 61–180 day guidance)
- Key Levels: Support at $347.00, Resistance at $370.00
OVERALL BIAS
OVERALL BIAS: BEARISH - Price is below every moving average with a death cross in place, −DI (42.0) far above +DI (16.8), MACD is expanding negative, and the Jun–Oct range support has broken on higher volume. Oversold RSI (30.3) and the lower-band extension raise the odds of a bounce along the way, so conviction is modest, but the trend evidence outweighs the mean-reversion case.
This is educational analysis and not financial advice.