IREN 76-day bearish forecast — Nov 1, 2026
- Bias: Bearish
- Timeframe: 76 days (made Nov 1, 2026, target date Jan 15, 2027)
- Price at analysis: $23.95
- Price target: $21.50
- Expected range: $18.75 – $25.50
- Result: Pending — graded after the close on Jan 15, 2027
Get a free AI analysis of IREN today
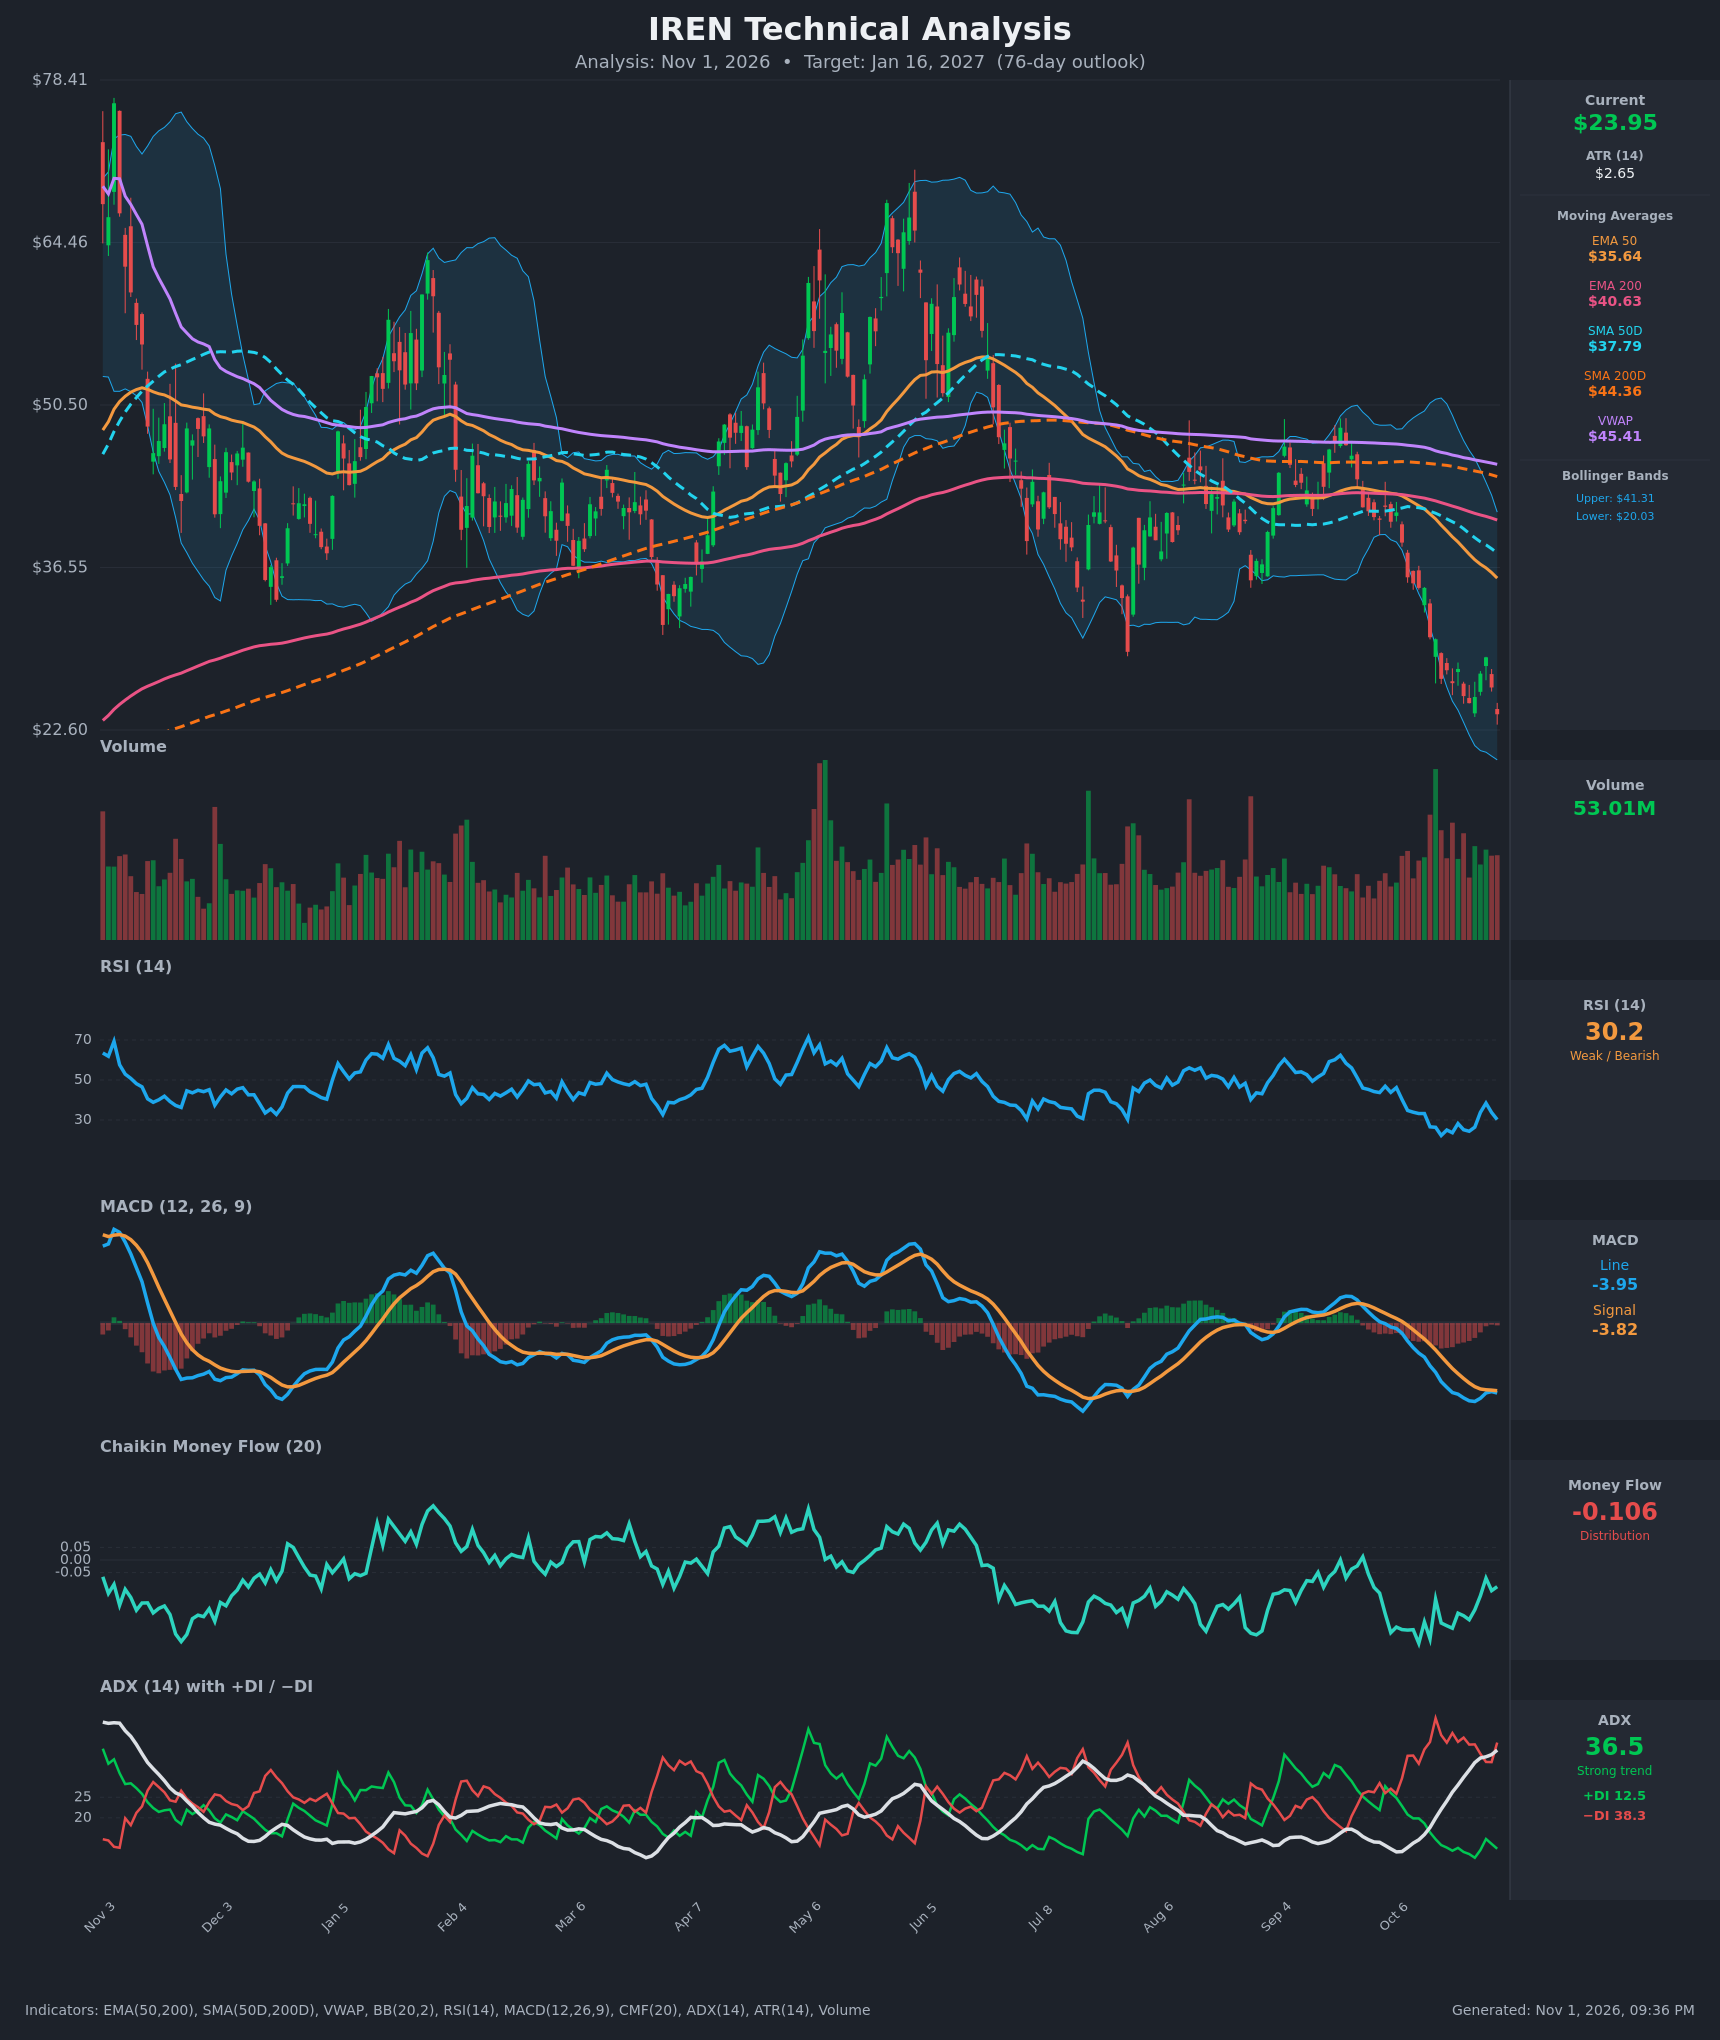
Analysis
TECHNICAL INDICATORS
- RSI (14): 30.20, just back at the oversold line after bottoming at 22.2 on Oct 16. The Oct 28 bounce to 38.4 failed and RSI is rolling over again. Momentum is weak, and the lower high on RSI confirms sellers still control rallies. [Bearish]
- 20 EMA: The 20 EMA is not provided. Price ($23.95) sits far below the EMA 50 ($35.64), EMA 200 ($40.63), SMA 50D ($37.79) and SMA 200D ($44.36). All are falling and act as stacked overhead resistance. [Bearish]
- MACD: Line -3.953 is below signal -3.823, with a slightly negative histogram (about -0.13). The line crossed below the signal again on Oct 30 after briefly narrowing. Both lines are deeply negative and well below zero. [Bearish]
- Bollinger Bands (20): Upper $41.31, lower $20.03. Price is in the lower third of the bands after riding the lower band during the sell-off. The bands are wide, so volatility is high. A walk down the lower band signals a trend, not necessarily a reversal. A bounce would likely stall at the mid-band (~$30.7). [Bearish]
- CMF (20): -0.106, below the -0.05 threshold and negative for most of the period since June. It improved from -0.33 on Oct 12, but remains in distribution. [Distribution]
- ADX (14): 36.5 and rising from 14.7 on Oct 12, so the trend is strengthening. -DI at 38.3 is far above +DI at 12.5, so bears are firmly in control. [Strong Trend – Bearish]
- Volume: 53.01M, elevated versus the typical range, with heavy volume on the recent red down-legs and capitulation-style spikes in late October. The bounce attempts came on weaker volume. This suggests active selling but no confirmed exhaustion yet. [Bearish / Possible capitulation]
DIVERGENCES & TRENDS
- There is no clear bullish RSI divergence. Price made a lower low ($23.95 vs. $24.91) while RSI (30.2) made a higher low than the Oct 16 trough (22.2), but this is a weak and unconfirmed signal.
- MACD histogram negativity has narrowed and then re-widened, so downward momentum is still intact.
- The MA structure is a death-cross regime. EMA 50 < EMA 200 and SMA 50D < SMA 200D, with both gaps widening.
- The ADX trend is rising with -DI dominant, which is the classic profile of a strong established downtrend.
- Price has broken below the multi-month support zone ($28–30, the Apr and Jul lows). That zone is now resistance.
- CMF has been below zero since June, in line with the price decline.
CHART PATTERNS
- Bearish Flag / Pennant (continuation): The Oct 23–28 bounce from ~$24.9 to $28.8 formed a small counter-trend consolidation, and the Oct 30 drop to $23.95 resolves it downward. The measured move (the pole of ~$34.8 → $27 ≈ $8) would point to the high teens/$20, so the lower Bollinger Band (~$20) is a logical first target.
- Broad downtrend / lower highs and lower lows: The peak near $70 in May has stepped down through each swing, a classic descending structure with the $28–30 breakdown.
- Reversal risk: There is no completed bullish reversal pattern (double bottom or inverted H&S) yet. A falling-wedge-type base would need a break above ~$28.8.
POTENTIAL SCENARIOS
- Scenario 1: Bearish Trend Continuation — The strong downtrend (ADX 36.5, -DI dominant, CMF negative, death-cross structure) keeps pushing price lower with weak bounces failing at $27–29. Trigger: a daily close below $22.60, the chart's low. Target: $20.00 (lower BB), then $18.75–$21.50 by the 76-day mark. Invalidation: a daily close above $28.84 with rising volume. (50% probability)
- Scenario 2: Bullish Oversold Relief Rally — RSI at 30 with capitulation volume sparks a mean-reversion bounce toward the mid-band and the prior breakdown zone. Trigger: a close above $26.25 and then $28.84, with RSI back above 40 and a MACD histogram turn. Target: $28–$30.7, with a stretch to the EMA 50 at ~$35 if momentum builds. Invalidation: a break below $20.00. (32% probability)
- Scenario 3: Neutral Basing Range — Price stabilizes after capitulation and chops between about $20 and $27 as volatility compresses. Trigger: ADX rolls over below 25 and price holds above $20. Target: $22–$26. Invalidation: a close beyond either $20 or $28.84. (18% probability)
PRICE TARGETS
- Target Price: $21.50 (76-day target, below the current price of $23.95)
- Expected Range: $18.75 to $25.50 (width $6.75 ≈ 28% of the current price, consistent with the 61–180 day guidance of 18–30%)
- Key Levels: Support at $20.00, Resistance at $28.84
OVERALL BIAS
OVERALL BIAS: BEARISH - Price is below every major moving average, ADX is 36.5 and rising with -DI far above +DI, MACD is below signal and CMF shows distribution. The $28–30 support zone has flipped to resistance. The oversold RSI (30) raises the risk of a relief bounce, but the trend evidence favors continuation toward the $20 lower-band area.
This is educational analysis and not financial advice.