MSTR 76-day bearish forecast — Nov 1, 2026
- Bias: Bearish
- Timeframe: 76 days (made Nov 1, 2026, target date Jan 15, 2027)
- Price at analysis: $130.51
- Price target: $120.00
- Expected range: $106.00 – $138.00
- Result: Pending — graded after the close on Jan 15, 2027
Get a free AI analysis of MSTR today
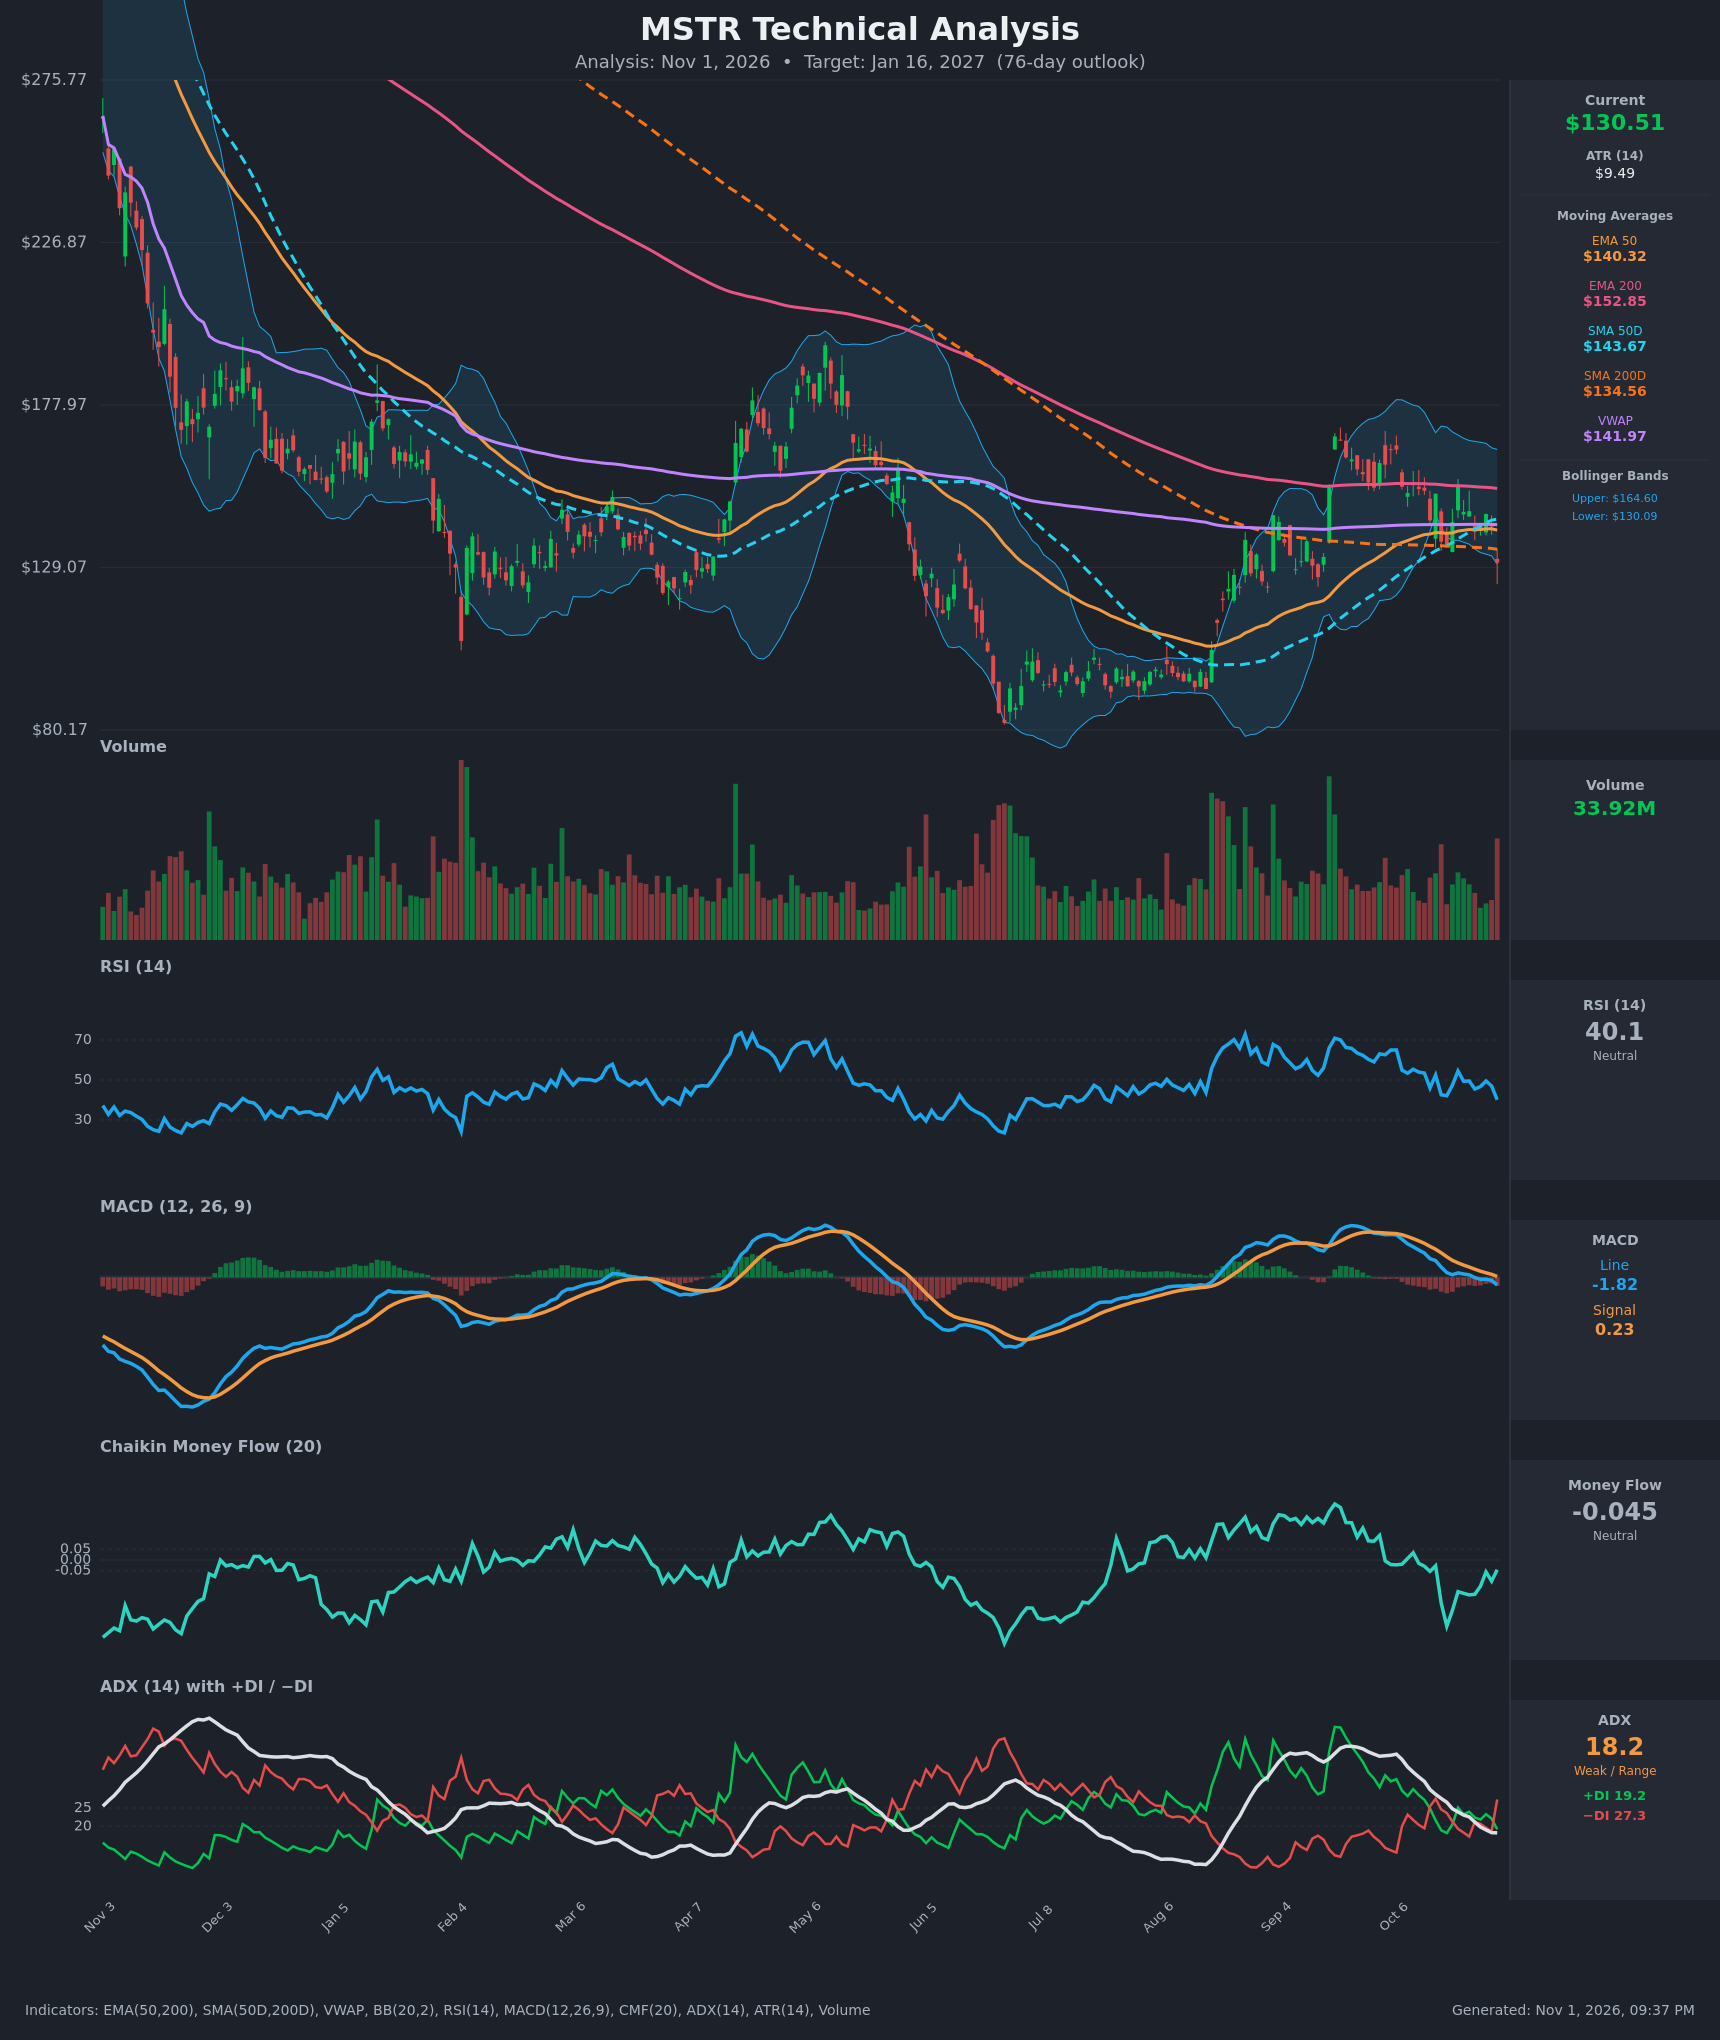
Analysis
TECHNICAL INDICATORS
- RSI (14): 40.11, down from 49.5 on Oct 28 and below the 50 midline. Momentum is fading but not oversold (<30), so there is room to fall further. [Bearish]
- 20 EMA: The 20 EMA is not supplied, so I use the EMA 50 at $140.32 instead. Price at $130.51 is about 7% below it, and the EMA 50 is also below the EMA 200 ($152.85), which is a bearish structure. The EMA 50 is flat and now acts as resistance. [Bearish]
- MACD: The line is -1.82 and the signal is 0.23. The line crossed below the signal around Oct 26, and the histogram is increasingly negative. Both lines are heading toward the zero line from above. [Bearish]
- Bollinger Bands (20): The upper band is $164.61 and the lower band is $130.09. Price closed at $130.51, right on the lower band after an 8% one-day drop. The band is wide, so volatility is elevated. A band-walk lower is possible, though a mean-reversion bounce toward the $141 mid-band is also possible. [Neutral]
- CMF (20): -0.045 is inside the neutral band (±0.05), but it has been negative for about 3 weeks, with a low of -0.31 on Oct 19. That points to mild distribution. [Neutral]
- ADX (14): 18.2 and falling, which is weak and range-bound. −DI (27.3) just jumped above +DI (19.2), so bears have regained control, but the trend is not yet strong. [Weak Trend, Bearish lean]
- Volume: 33.92M on the latest bar, the highest in several weeks, on a red candle that closed at the lows. High volume on a down move suggests real selling pressure. [Bearish]
DIVERGENCES & TRENDS
- There is no clear divergence. Price is making lower closes and RSI, MACD and CMF are all confirming with lower readings.
- The Oct 21 high of $153.48 matched the Oct 12 high of about $152.68, while RSI and MACD peaked lower. This is a mild bearish momentum divergence at the double-top highs.
- Price has closed below the VWAP (about $141.97), the EMA 50 ($140.32) and the SMA 50 ($143.67). It is also just below the SMA 200D ($134.56), a key long-term pivot.
- The SMA 50D ($143.67) is above the SMA 200D ($134.56), so there is no death cross. However, the SMA 50D is rolling over while the SMA 200D is also declining, so the bullish alignment is eroding.
- The EMA 50 sits below the EMA 200, so the longer-term trend remains down.
- The −DI/+DI flip on the last bar is a fresh bearish signal, but ADX below 20 means follow-through is not yet confirmed.
CHART PATTERNS
- Bearish Double Top: Highs near $152–153 (Oct 12 and Oct 21) with a neckline around $130–136. The last bar is breaking toward that neckline. The measured move is about $153 − $130 ≈ $23, which projects to roughly $107.
- Resistance cluster: The EMA 200 (about $153), the SMA 50D and the VWAP (about $142) form a ceiling of overlapping resistance. The September–October rally stalled right under the EMA 200.
- Larger context: The multi-month structure is a series of lower highs from the $275 area. This is a bear-market-style downtrend with recovery bounces.
- Counterpoint: The Aug–Oct recovery from about $95 has been a higher-low sequence. Price is also sitting on the SMA 200D and the lower Bollinger Band, which are potential support.
POTENTIAL SCENARIOS
- Scenario 1: Bearish Double-Top Breakdown — Price closes below the $130 neckline and the SMA 200D, and the −DI/ADX combination strengthens. Sellers push toward the measured move and the prior consolidation zone. Trigger: daily close below $128 on elevated volume. Target: $112–$107, with $120 as an interim stop. Invalidation: daily close back above $141 (VWAP/EMA 50). (55% probability)
- Scenario 2: Bullish Reclaim and Bounce — The lower-band and SMA 200D support hold and RSI turns up from about 40. Price mean-reverts to the $141–$145 cluster, possibly retesting the EMA 200 at about $153. Trigger: close above $142 with CMF turning positive. Target: $145–$153. Invalidation: close below $125. (28% probability)
- Scenario 3: Neutral Range Chop — Price oscillates between about $120 and $142 as ADX stays below 20. Trigger: failed breakdown with no follow-through. Target: $125–$138. Invalidation: close outside the range on volume. (17% probability)
PRICE TARGETS
- Target Price: $120.00 (76-day horizon, about -8% from $130.51)
- Expected Range: $106.00 to $138.00 (width $32 ≈ 24.5% of current price, consistent with the 61–180 day guidance)
- Key Levels: Support at $115.00, Resistance at $140.32
OVERALL BIAS
OVERALL BIAS: BEARISH - Price sits at the lower Bollinger Band after a high-volume 8% drop. It is below the EMA 50, EMA 200, SMA 50D and VWAP, MACD has crossed bearishly, −DI has taken over, and a double top near $153 projects toward about $107. The weak ADX and the SMA 200D/lower-band support keep conviction moderate.
This is educational analysis and not financial advice.