MARA 76-day bullish forecast — Nov 1, 2026
- Bias: Bullish
- Timeframe: 76 days (made Nov 1, 2026, target date Jan 15, 2027)
- Price at analysis: $6.77
- Price target: $7.60
- Expected range: $6.00 – $7.95
- Result: Pending — graded after the close on Jan 15, 2027
Get a free AI analysis of MARA today
Analysis
TECHNICAL INDICATORS
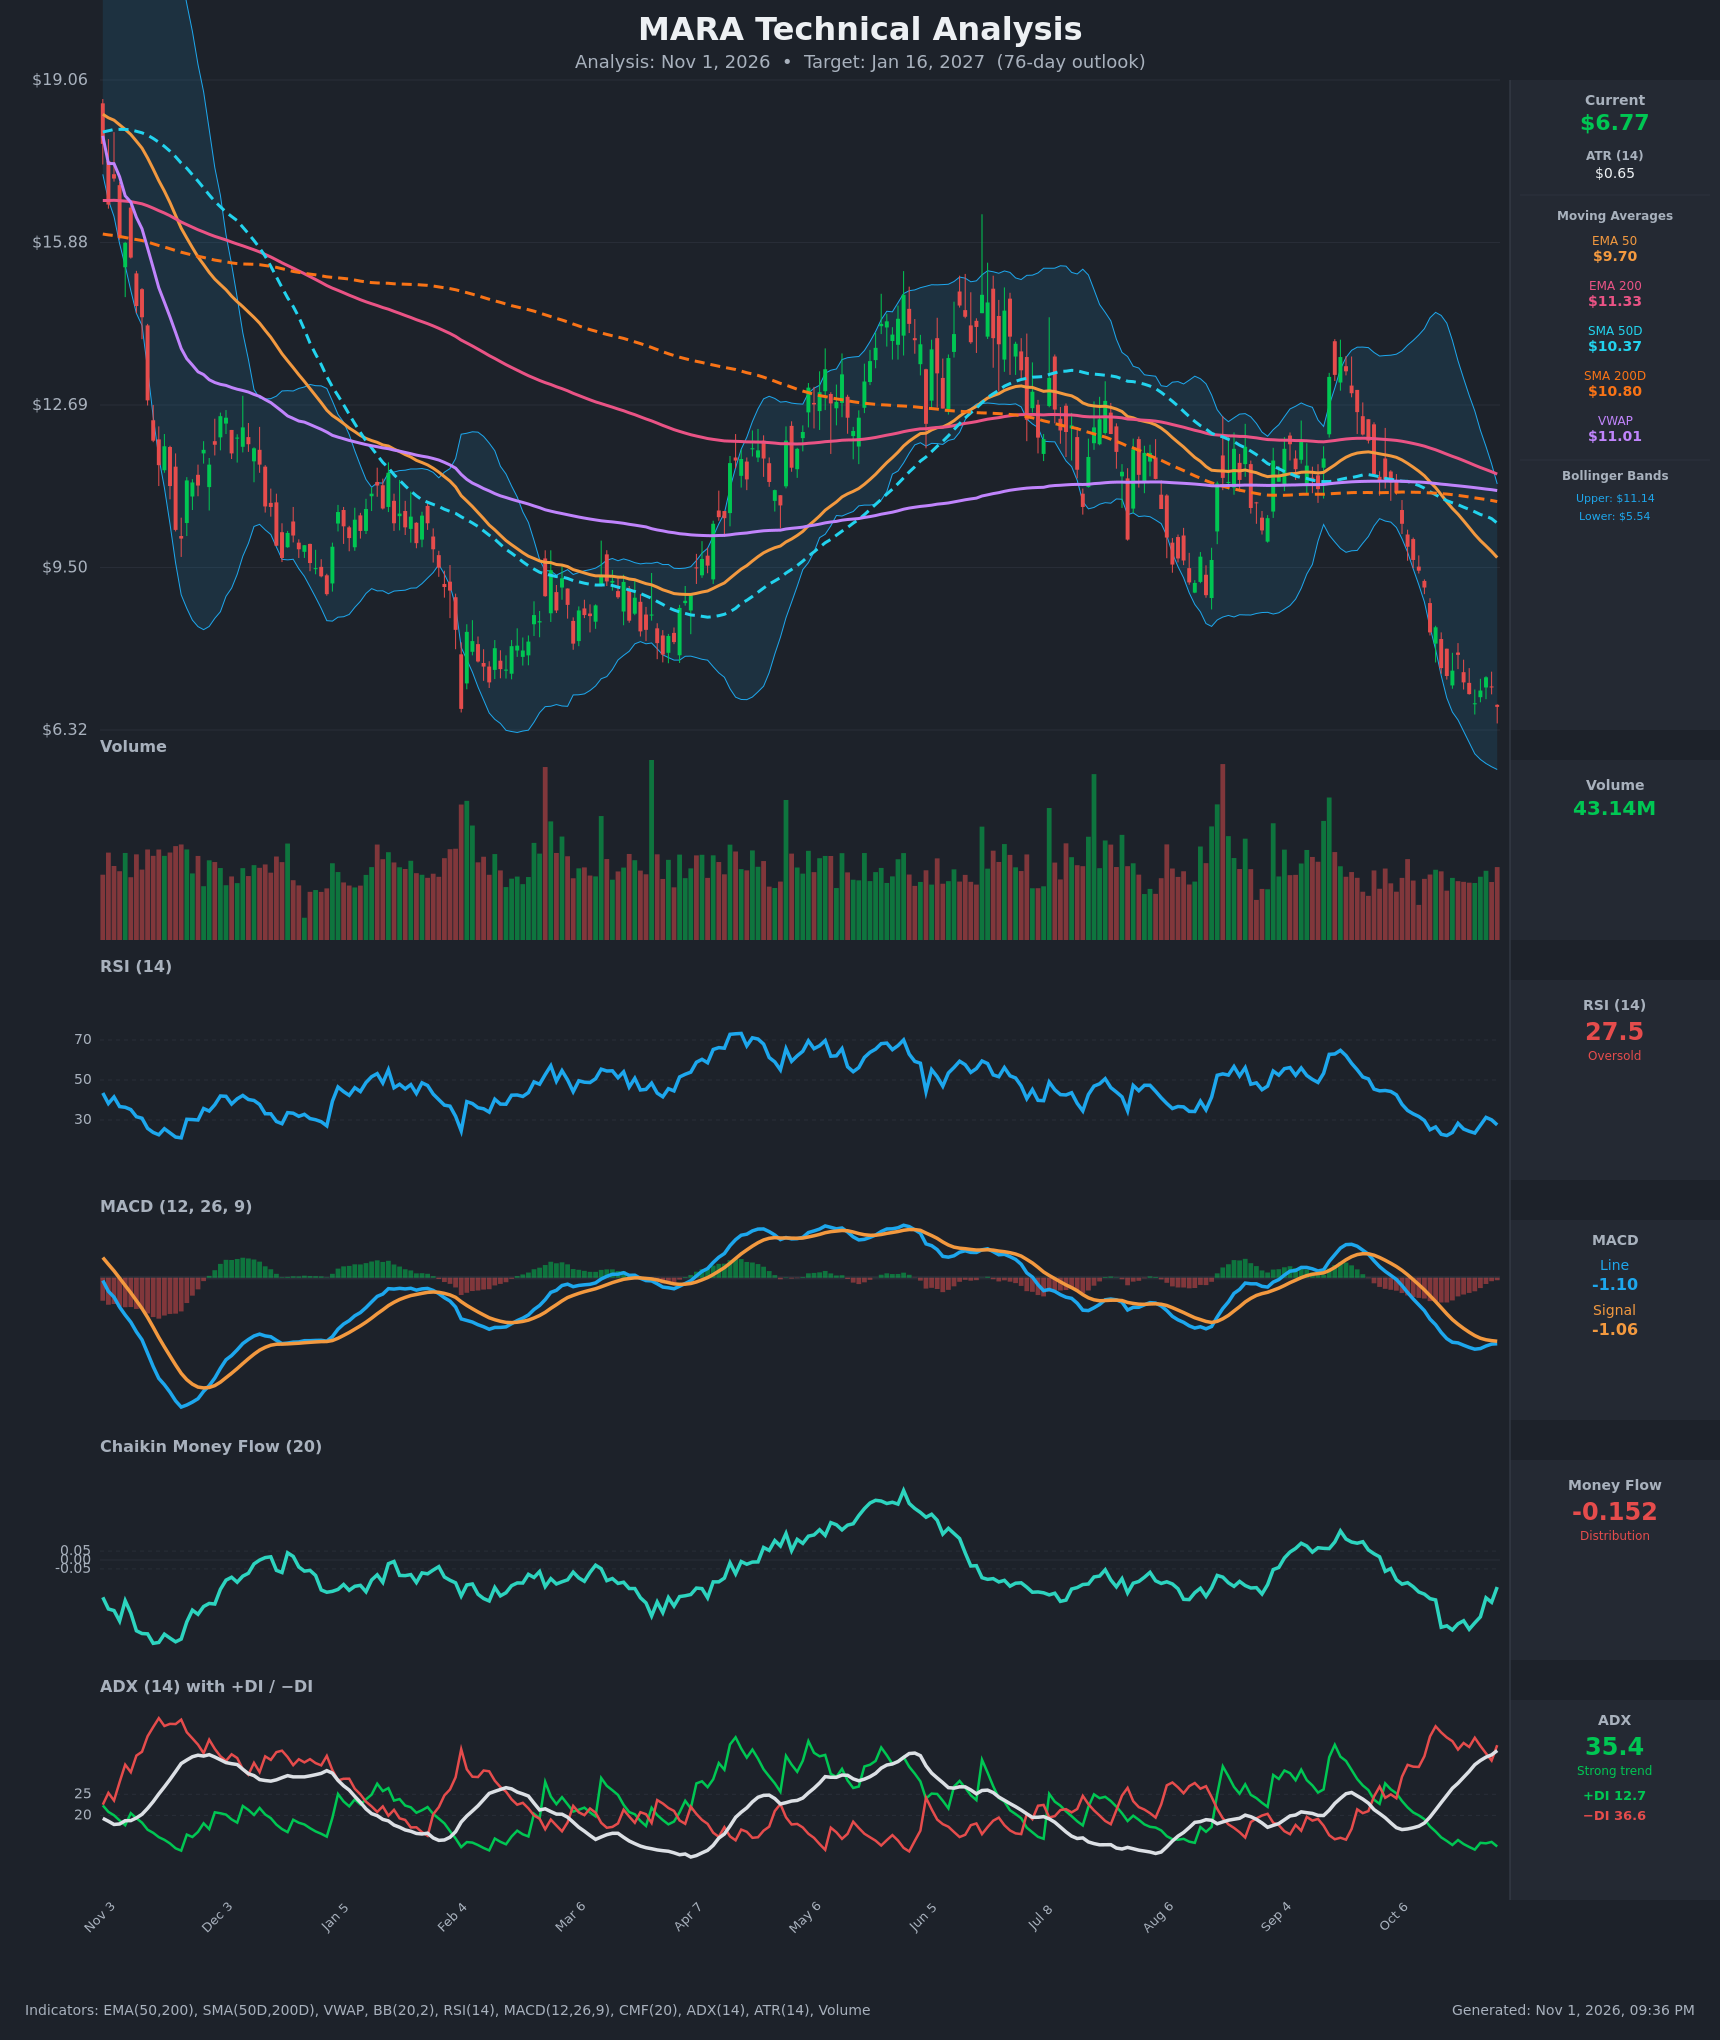
- RSI (14): 27.55, in oversold territory. It was 23.5 at the Oct 26 low, so the current low sits well above that reading even though price is now lower. Momentum is stabilizing rather than accelerating down. [Neutral]
- 20 EMA: No EMA 20 is plotted. Using the Bollinger midline (20-period average, about $8.34) as a proxy, price at $6.77 is about 19% below it, so it acts as resistance. The EMA 50 ($9.70) and EMA 200 ($11.33) are stacked above price and still falling. [Bearish]
- MACD: Line -1.0985, signal -1.0567, histogram about -0.04. The line is still below the signal, but the gap has shrunk from about -0.31 on Oct 21 to nearly zero, and the line is making a higher low (-1.10 vs -1.19 on Oct 26). A bullish crossover is close. [Neutral]
- Bollinger Bands (20): Upper $11.14, lower $5.54, midline about $8.34. Price is in the lower third of an expanded band after a steep walk down. It is about $1.23 above the lower band, so it is not yet at a statistical extreme. Mean-reversion toward the midline is possible, but the bands also show strong downside volatility. [Bearish]
- CMF (20): -0.152, which is distribution. It has improved from -0.392 (Oct 20) and -0.352 (Oct 26), so selling pressure is easing, though it remains below -0.05. [Distribution]
- ADX (14): 35.4 and rising, with −DI (36.6) far above +DI (12.7). This is a strong, established downtrend. ADX at this level after a steep drop often signals a mature move, so the trend is strong but extended. [Strong Trend – Bearish]
- Volume: 43.14M. Volume has been muted and fading on the recent decline, with no capitulation spike. The selloff has been orderly. That supports the downtrend's persistence, but it also means there is little panic selling to exhaust. [Neutral / Mildly Bearish]
DIVERGENCES & TRENDS
- Bullish divergence: Price made a lower low on Oct 30 ($6.77 vs $6.84 on Oct 26). RSI made a higher low (27.5 vs 23.5), MACD made a higher low (-1.099 vs -1.188), and CMF improved (-0.152 vs -0.352). Three momentum and flow measures are diverging from price.
- Moving averages: Price is below the EMA 50, EMA 200, SMA 50D, SMA 200D and VWAP ($11.01). A death cross has formed on both pairs: the SMA 50D crossed below the SMA 200D around Oct 15, and the EMA 50 is well below the EMA 200. The long-term trend is clearly down.
- ADX/DI: −DI has been above +DI throughout, and ADX has climbed from 17.5 to 35.4 in 15 bars. There is no DI crossover, so bears remain in control. +DI is very depressed (12.7), a condition that often precedes a relief bounce.
- Crossovers: The MACD line and signal are converging, and a bullish crossover could come within days if price stabilizes.
- Trend vs. momentum: The trend indicators are all bearish, while the momentum and flow indicators are improving. That gives a conflict between a strong downtrend and a developing bullish divergence at oversold levels.
CHART PATTERNS
- Possible Bullish Double Bottom: Price is revisiting the February swing low area (about $6.5–$7.0). If this zone holds and price clears the swing highs near $7.35–$7.80, a double bottom would be confirmed. The measured move would target roughly $8.3–$8.8.
- Descending structure / continuation risk: The broader picture shows lower highs ($15+ in June, then about $13.3 in September) followed by a sharp breakdown. This resembles a Bearish Head and Shoulders / lower-high sequence. A decisive break below the February low would reopen the lower Bollinger Band and the $5.50 area.
- Significance: The pattern read is mixed. The double-bottom retest is the most actionable structure, with the stop-loss logic below roughly $6.30–$6.50.
POTENTIAL SCENARIOS
- Scenario 1: Bullish Oversold Relief Rally / Double Bottom — Triple bullish divergence (RSI, MACD, CMF) at a prior support zone drives a MACD bullish crossover and a mean-reversion bounce toward the Bollinger midline. Trigger: MACD bullish crossover and a daily close above $7.35–$7.80. Target: $7.60–$8.30. Invalidation: daily close below $6.30. (50% probability)
- Scenario 2: Bearish Trend Continuation — The strong downtrend (ADX 35, −DI dominant, death crosses) persists and support at the February low fails. Trigger: close below $6.30 on rising volume. Target: $5.54 (lower Bollinger Band) and possibly $5.00–$5.30. Invalidation: close above $7.80. (35% probability)
- Scenario 3: Neutral Basing Range — Price chops sideways between about $6.30 and $7.80 as selling exhausts but buyers stay cautious. Trigger: failed MACD crossover and flat RSI in the 30–40 zone. Target: $6.50–$7.50. Invalidation: close outside $6.30–$7.80. (15% probability)
PRICE TARGETS
For a 76-day horizon, the range width should be about 18–30% of the current price. The proposed range is $6.00 to $7.95, a width of $1.95 (about 28.8% of $6.77), which fits.
- Target Price: $7.60 (76 days)
- Expected Range: $6.00 to $7.95
- Key Levels: Support at $5.54, Resistance at $7.80
OVERALL BIAS
OVERALL BIAS: BULLISH – Price is oversold at the February support zone, with bullish divergences on RSI, MACD and CMF and a MACD crossover close at hand. This favors a relief rally toward $7.60 over 76 days. Conviction is modest, because the trend indicators (ADX 35, −DI dominance, death crosses, price below all moving averages) remain firmly bearish, and a break below $6.30 would invalidate the view.
This is educational analysis and not financial advice.