NIO 76-day bearish forecast — Nov 1, 2026
- Bias: Bearish
- Timeframe: 76 days (made Nov 1, 2026, target date Jan 15, 2027)
- Price at analysis: $3.21
- Price target: $3.00
- Expected range: $2.65 – $3.45
- Result: Pending — graded after the close on Jan 15, 2027
Get a free AI analysis of NIO today
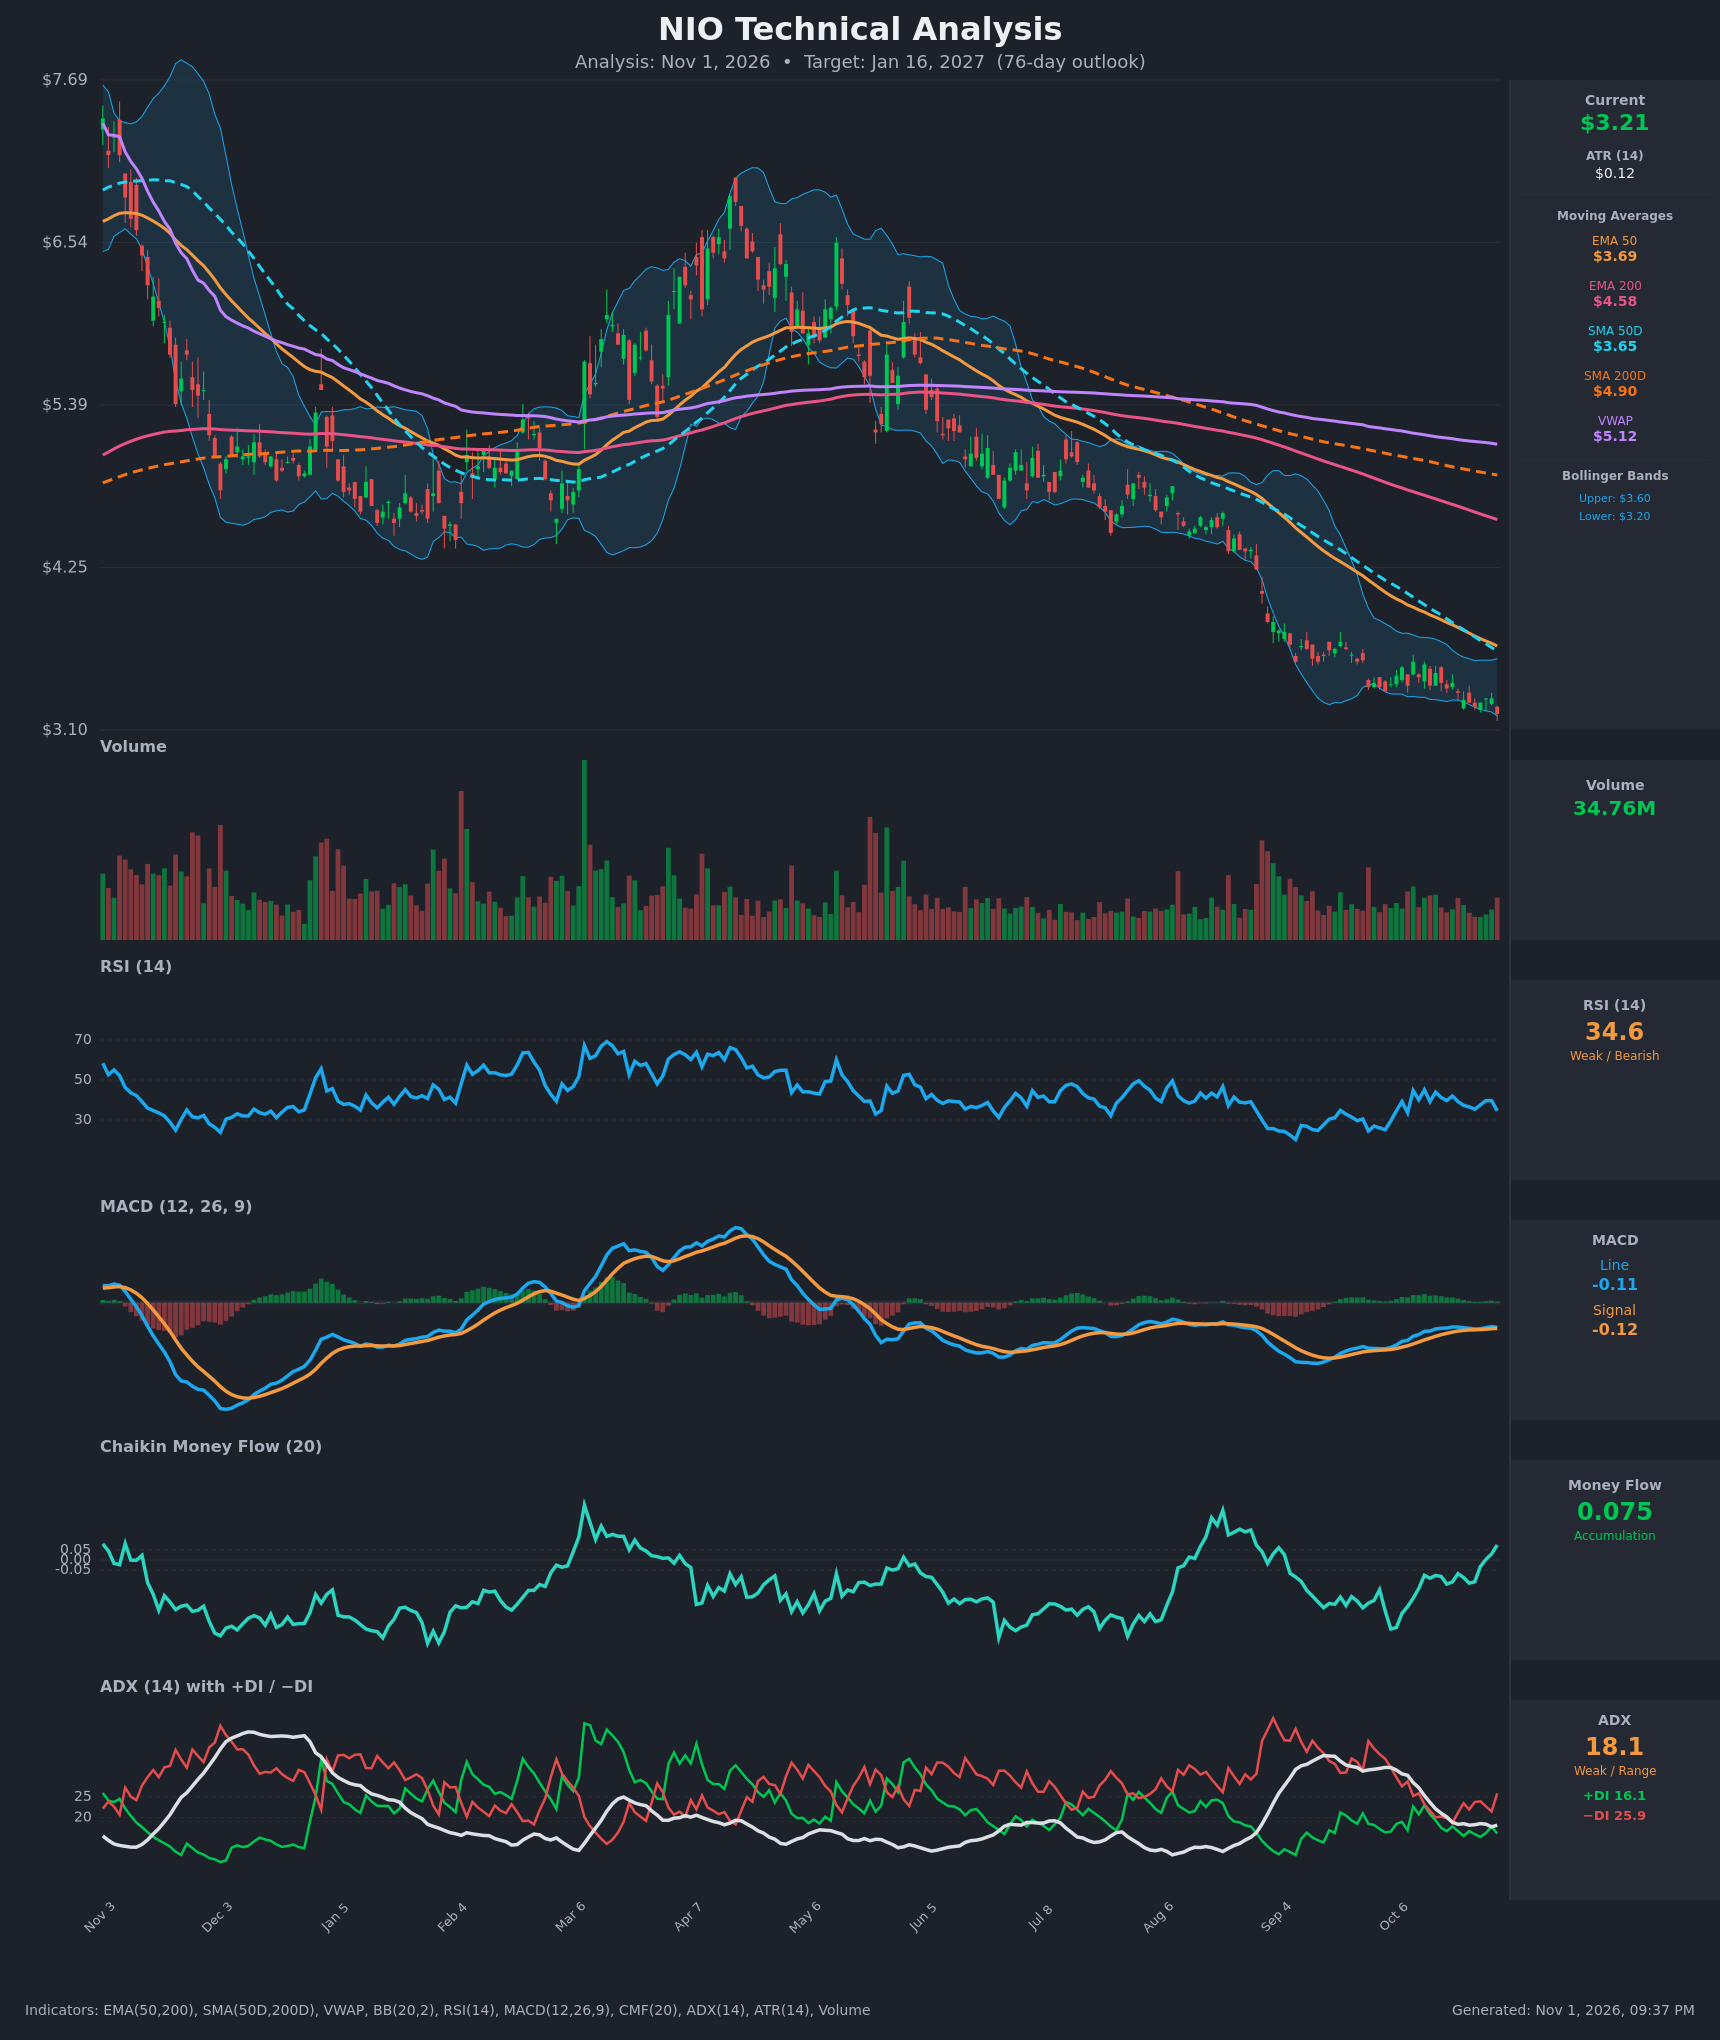
Analysis
TECHNICAL INDICATORS
- RSI (14): 34.60, down from 39.7 two bars ago and below the 40 level that has capped rallies since August. It is not yet oversold (<30). The September low was near 26, so the current reading is a higher low than price implies. Momentum is weak but not washed out. [Bearish]
- 20 EMA: Not supplied. The EMA 50 at $3.69 and SMA 50D at $3.65 are both falling about $0.02 a day. Price at $3.21 is roughly 13% below them, so they act as overhead resistance. [Bearish]
- MACD: Line -0.1119 vs signal -0.1166, so the histogram is slightly positive at about +0.005. The line is just above the signal after a marginal crossover, but both sit below zero and the line is not rising (-0.108 on Oct 29, -0.112 now). This is a weak, flat momentum signal, not a reversal. [Neutral]
- Bollinger Bands (20): Upper $3.60, lower $3.1971. Price at $3.21 is hugging the lower band and has been walking it since early September. That shows persistent downside pressure, though it also leaves the stock stretched for a short-term bounce toward the $3.40 mid-band. [Bearish]
- CMF (20): 0.075, up from -0.116 on Oct 23 and above +0.05 for the first time in this decline. Buying pressure is building at the lows, which is a notable contrarian positive. [Accumulation]
- ADX (14): 18.1 with −DI 25.9 above +DI 16.1. The trend is weak (<20), but the bears control direction and the DI spread widened on the last bar. ADX has fallen from 27 to 18, so the decline is losing strength even though it has not reversed. [Weak Trend, Bearish direction]
- Volume: 34.76M, ordinary and well below the capitulation-type spikes seen earlier in the year. The recent drop to new lows came on subdued volume. That points to drifting selling rather than panic, and no volume spike confirms a bottom. [Neutral / No capitulation]
Moving-average structure is clearly bearish:
- EMA 50 ($3.69) is below EMA 200 ($4.58), and SMA 50D ($3.65) is below SMA 200D ($4.90), a death cross that has been in place for months.
- Price is below all moving averages and well below VWAP ($5.12).
DIVERGENCES & TRENDS
- Bullish divergence (CMF): price has made new lows while CMF rose from about -0.12 to +0.075. Accumulation at the lows is the main counter-trend signal.
- Bullish divergence (RSI): RSI is 34.6 at a new price low, versus about 26 at the September low. This is a mild higher-low divergence.
- MACD: the line is flat and hugging the signal. There is no real bullish momentum thrust, and the MACD stayed below zero throughout.
- Trend: a persistent series of lower highs and lower lows since the $6.90 peak in April. Price has fallen from about $5.80 in June to $3.21 and is now at the bottom of the chart's range.
- ADX decline from 27 to 18 suggests selling momentum is fading. That raises the chance of base-building but does not confirm it.
- DI: −DI over +DI persists, with a fresh widening on the last bar.
CHART PATTERNS
- Descending channel / bearish continuation: the staircase of lower highs and lows resembles the Bearish Flag/Pennant continuation structure in the reference diagram. Price shows a tight consolidation (about $3.26-$3.56) after the sharp August-September drop. A break below roughly $3.20 would target about $3.00 or lower (flag-pole projection is more extended, toward $2.80).
- Possible Bullish Falling Wedge: the Oct 12-30 range of lower highs and slowly lower lows, with a rising CMF, could be read as a falling wedge, a bullish reversal candidate. It needs a break above about $3.45-$3.50 with CMF still positive to confirm. Target would be $3.65-$3.70 (EMA 50/SMA 50D).
- Neither pattern is confirmed yet. The trend and moving-average alignment favor the bearish continuation reading.
POTENTIAL SCENARIOS
- Scenario 1: Bearish Trend Continuation — Price stays below falling EMA/SMA 50 resistance and breaks the October low and lower Bollinger Band, drifting lower as −DI stays dominant. Trigger: daily close below $3.19 (lower band / chart low), with RSI falling below 30. Target: $3.00, with an extension to $2.80. Invalidation: daily close above $3.65 (EMA 50/SMA 50D). (50% probability)
- Scenario 2: Bullish Relief Bounce / Base Formation — CMF accumulation and RSI divergence trigger a mean-reversion rally from the lower band. Price retraces toward the declining moving averages but stalls under major resistance. Trigger: close above $3.45-$3.50 on rising volume. Target: $3.65-$3.70. Invalidation: close below $3.10. (35% probability)
- Scenario 3: Neutral Basing Range — Weak ADX (<20) keeps price pinned between about $3.10 and $3.55 for most of the period. Trigger: repeated failures at both edges with volume staying flat. Target: about $3.20-$3.40. Invalidation: close outside $3.00-$3.65. (15% probability)
PRICE TARGETS
- Target Price: $3.00 (76-day horizon)
- Expected Range: $2.65 to $3.45. The width is $0.80, or about 25% of the $3.21 price, consistent with the 61-180 day guidance of 18-30%.
- Key Levels: Support at $3.10, Resistance at $3.60
OVERALL BIAS
OVERALL BIAS: BEARISH - Price is below every major moving average, with a long-standing death cross, −DI dominant, RSI under 40, and price walking the lower Bollinger Band at new lows. Positive CMF and a flat-to-improving MACD offer a credible bounce case, but they lack trend confirmation, so the downtrend is more likely to extend modestly.
This is educational analysis and not financial advice.