PFE 76-day bullish forecast — Nov 1, 2026
- Bias: Bullish
- Timeframe: 76 days (made Nov 1, 2026, target date Jan 15, 2027)
- Price at analysis: $30.52
- Price target: $32.00
- Expected range: $27.80 – $34.30
- Result: Pending — graded after the close on Jan 15, 2027
Get a free AI analysis of PFE today
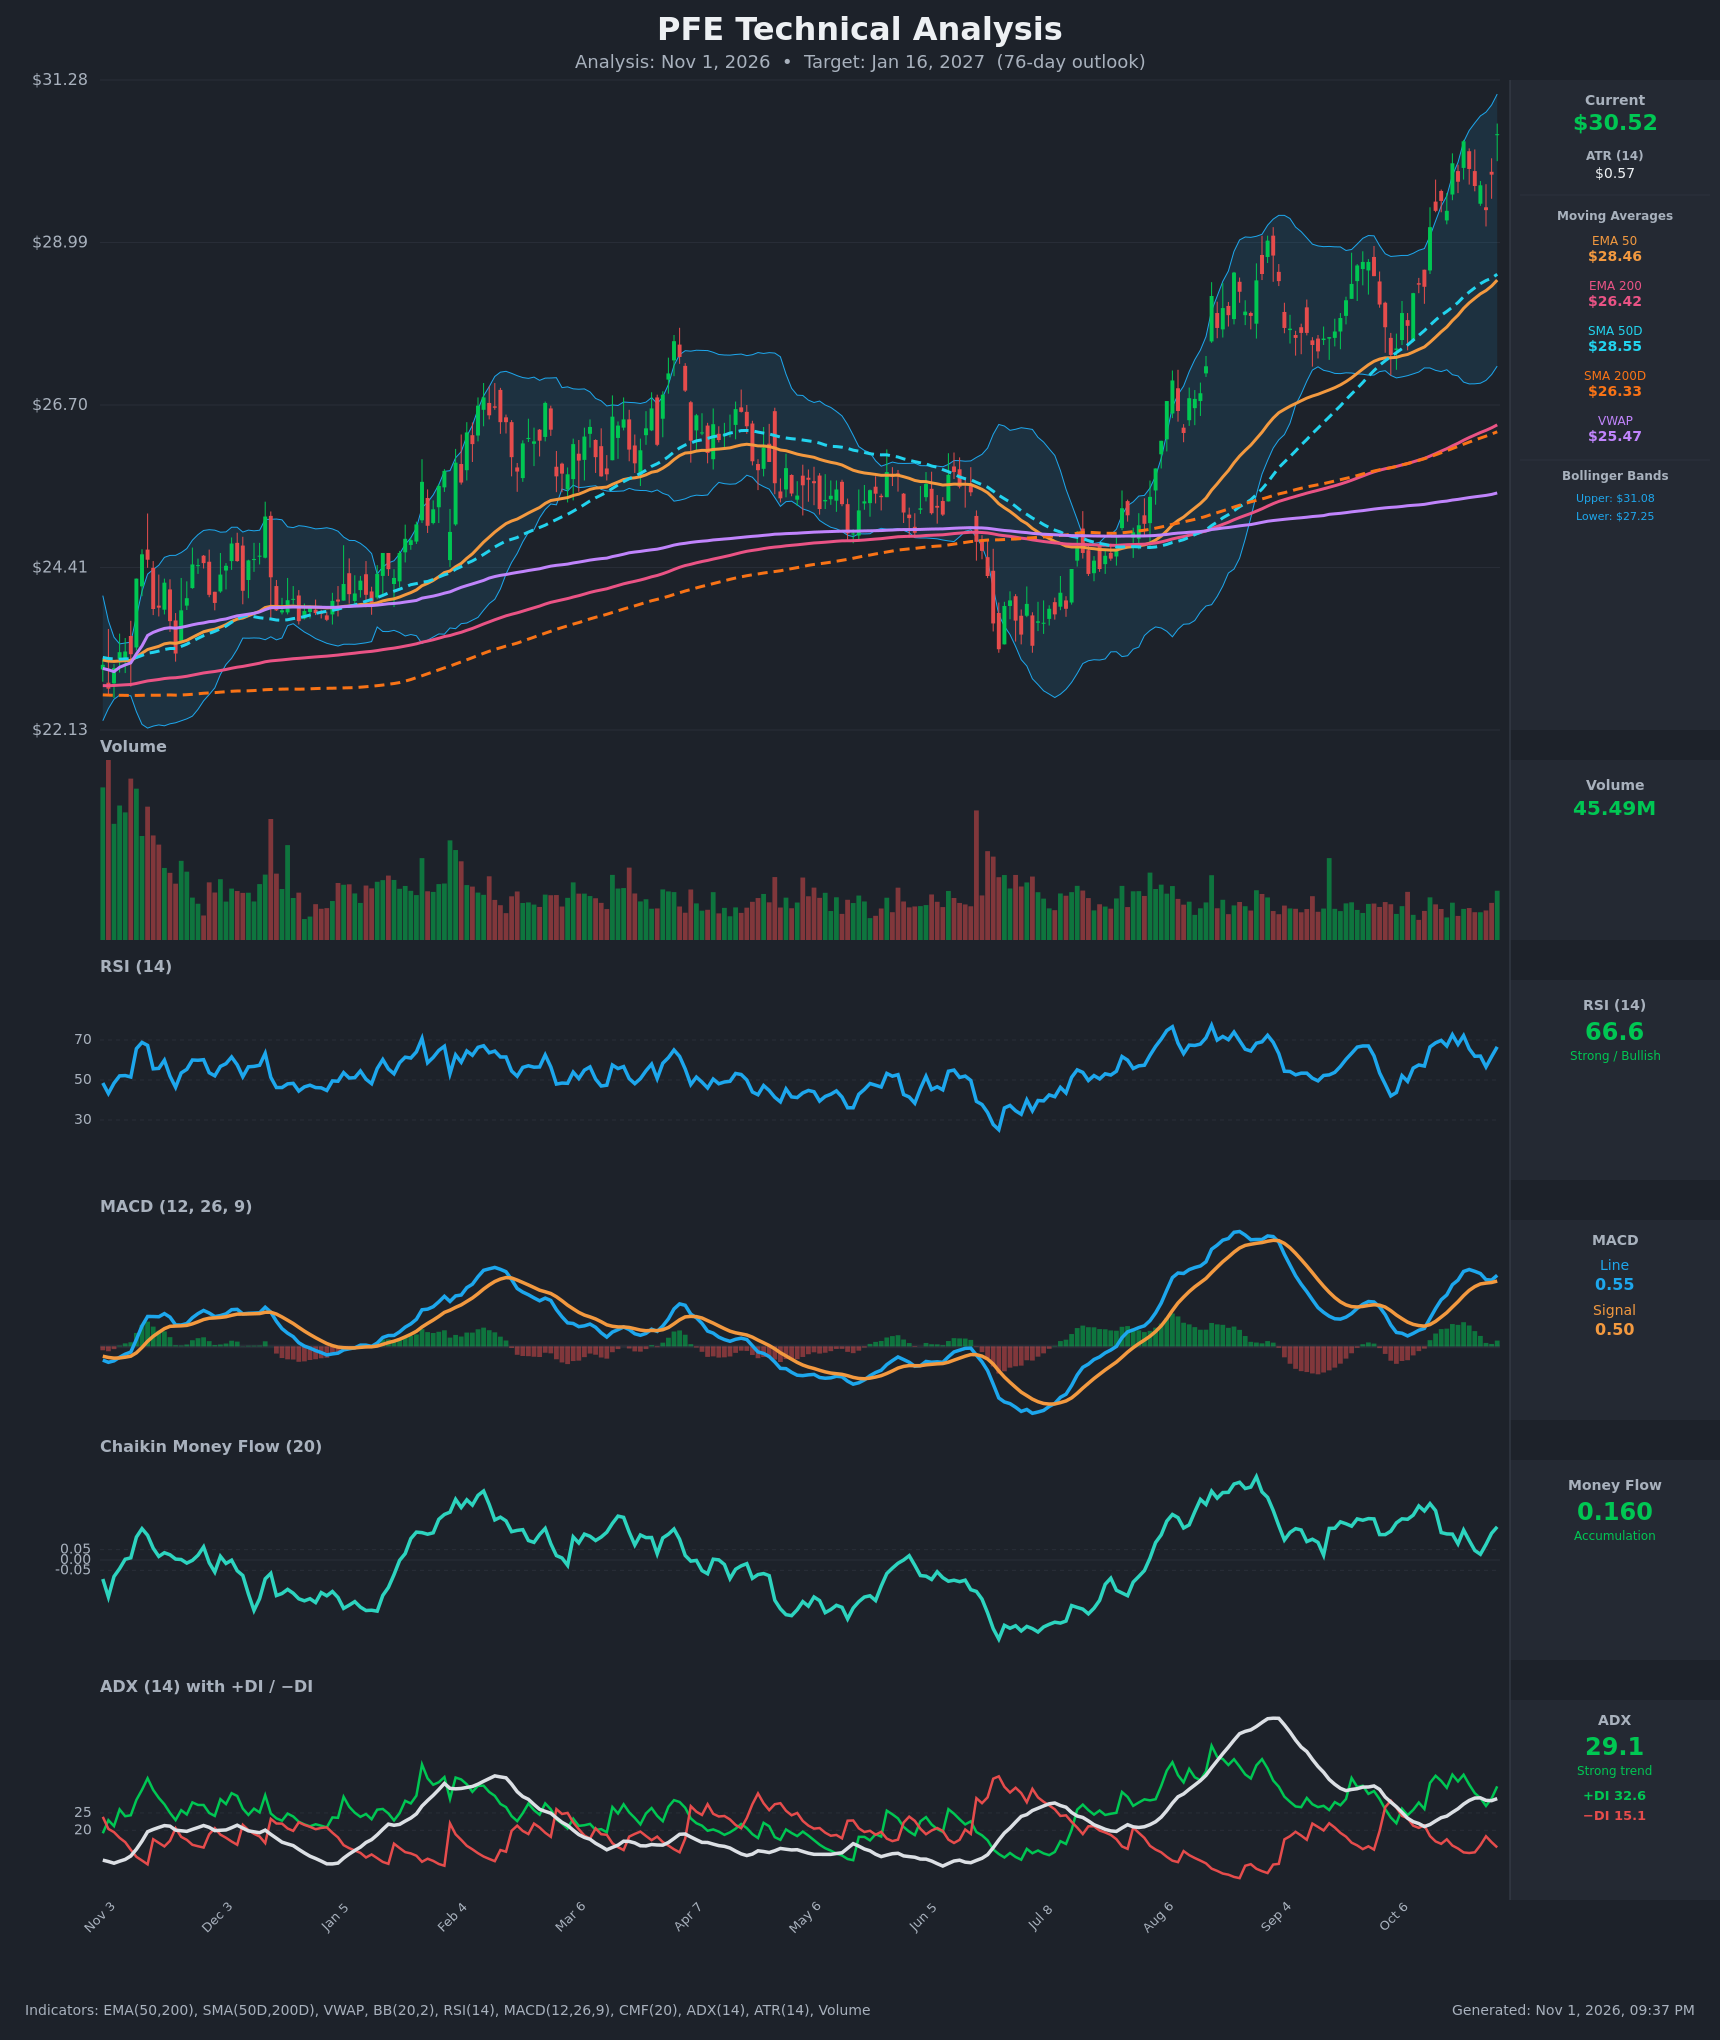
Analysis
TECHNICAL INDICATORS
- RSI (14): 66.58, just below the 70 overbought line. It has oscillated between about 56 and 73 over the last 15 bars, so momentum is strong but not stretched. It has recovered from 56.5 on Oct 28. [Bullish]
- 20 EMA: The 20 EMA isn't supplied. The EMA 50 is $28.46 and price at $30.52 is about 7% above it, with the 50-period averages sloping up. Pullbacks toward the high-$29s to $28.5 would be the first support zone. [Bullish]
- MACD: Line 0.549 is above signal 0.504, and the histogram is slightly positive (~0.045). The line dipped toward the signal on Oct 28 (0.515 vs 0.489) and re-expanded, which is a bullish hold of the trend. Both lines are above zero. [Bullish]
- Bollinger Bands (20): Upper $31.08, lower $27.25, so the middle band is about $29.17. Price is in the upper quarter of the bands, about $0.56 below the upper band, with a mild "walk the band" tendency. Bands are wide after the strong rally, so some mean reversion toward the midline is plausible. [Bullish]
- CMF (20): 0.160, well above +0.05 and consistently positive for the last 15 bars (0.03 to 0.27). This shows steady accumulation. [Accumulation]
- ADX (14): 29.1 with +DI 32.6 over −DI 15.1. ADX is above 25 and has been stable to rising, so the trend is strong with bulls in clear control. [Strong Trend – Bullish]
- Volume: 45.49M, around or modestly above recent average. The up-days are accompanied by solid volume with no heavy distribution bars in the rally. This supports the advance. [Supportive / Bullish]
DIVERGENCES & TRENDS
- No bearish RSI divergence: price is at a new swing high ($30.52) and RSI at 66.6 is below its Oct 20 peak of 72.7. This is a mild momentum lag, but not a clear divergence. RSI is rangebound at 56–73 while price makes higher highs, which deserves monitoring.
- MACD is making a lower high relative to the Aug–Sep peak, but the Aug peak came from a different leg, so it is not a pattern that affects the current rally.
- Moving averages are in a golden-cross configuration: SMA50D ($28.55) is above SMA200D ($26.33), and EMA50 ($28.46) is above EMA200 ($26.42). Both gaps are widening. Price is above SMA200D, which means the long-term uptrend is intact.
- VWAP ($25.47) sits far below price, so buyers are firmly in control of the anchored period.
- Trend: the chart shows a large V-shaped recovery from the ~$23 low in Jul to $30.5, with higher highs and higher lows since August. ADX and the DIs confirm it. Price is extended (~7% above the 50-day averages), so a consolidation or pullback is likely along the way.
CHART PATTERNS
- Bullish Flag / Pennant (continuation): since the Aug–Sep push to ~$28.5–29, price has consolidated in a rising channel and broken to new highs near $30.5. This is closest to a bullish continuation structure from the reference. The measured move, based on a pole of ~$5 ($24.5 to ~$29.5), would imply a theoretical extension toward $33–35, but I will haircut this.
- Ascending-type structure: the higher lows in the Sep–Oct period beneath resistance at ~$30 are consistent with an ascending triangle breakout, and $30–30.4 is now the key breakout area to hold.
- Risk: a rising wedge-like climb with decreasing RSI peaks near the upper band is a possible failure, so a close back below ~$29.4 would weaken the breakout.
POTENTIAL SCENARIOS
- Scenario 1: Bullish Trend Continuation — The breakout above ~$30.4 holds after a shallow retest of $29.5–30, and the trend (ADX 29, +DI dominant, CMF positive) keeps pushing price higher. Trigger: sustained closes above $30.50 and MACD staying above its signal. Target: $32.50–$34.00. Invalidation: daily close below $28.50 (EMA50/SMA50 area). (50% probability)
- Scenario 2: Bullish-Consolidation Then Grind Higher — Price is extended and pulls back toward the midline/EMA50 ($28.5–29.5), then resumes the uptrend, ending the period modestly above the current level. Trigger: RSI cooling to ~50 and a bounce from $28.5–29. Target: $30.50–$32.00. Invalidation: close below $27.25 (lower band). (28% probability)
- Scenario 3: Bearish Failed Breakout — Overextension with an RSI-lag rejection from the upper band leads to a failed breakout, a loss of the 50-day averages and a drop toward the 200-day. Trigger: close below $28.40 with MACD bearish crossover and CMF below zero. Target: $26.50–$27.50. Invalidation: reclaim of $30.50 on strong volume. (22% probability)
PRICE TARGETS
- Target Price: $32.00 (76-day timeframe)
- Expected Range: $27.80 to $34.30 (width $6.50 ≈ 21.3% of current price, consistent with the 61–180 day guidance)
- Key Levels: Support at $29.50 (breakout retest zone, with deeper support at EMA50/SMA50 ~$28.50), Resistance at $31.10 (upper Bollinger band, then $33.00)
OVERALL BIAS
OVERALL BIAS: BULLISH - The trend is strong: ADX 29 with +DI well above −DI, a golden-cross alignment of all moving averages, positive CMF accumulation (0.16), and MACD above its signal with price breaking to new highs. The extended price (7% above the EMA50) argues for pullback risk, but the weight of evidence favors higher prices over 76 days.
This is educational analysis and not financial advice.