SLV 76-day bearish forecast — Nov 1, 2026
- Bias: Bearish
- Timeframe: 76 days (made Nov 1, 2026, target date Jan 15, 2027)
- Price at analysis: $44.60
- Price target: $41.50
- Expected range: $35.00 – $49.50
- Result: Pending — graded after the close on Jan 15, 2027
Get a free AI analysis of SLV today
Analysis
TECHNICAL INDICATORS
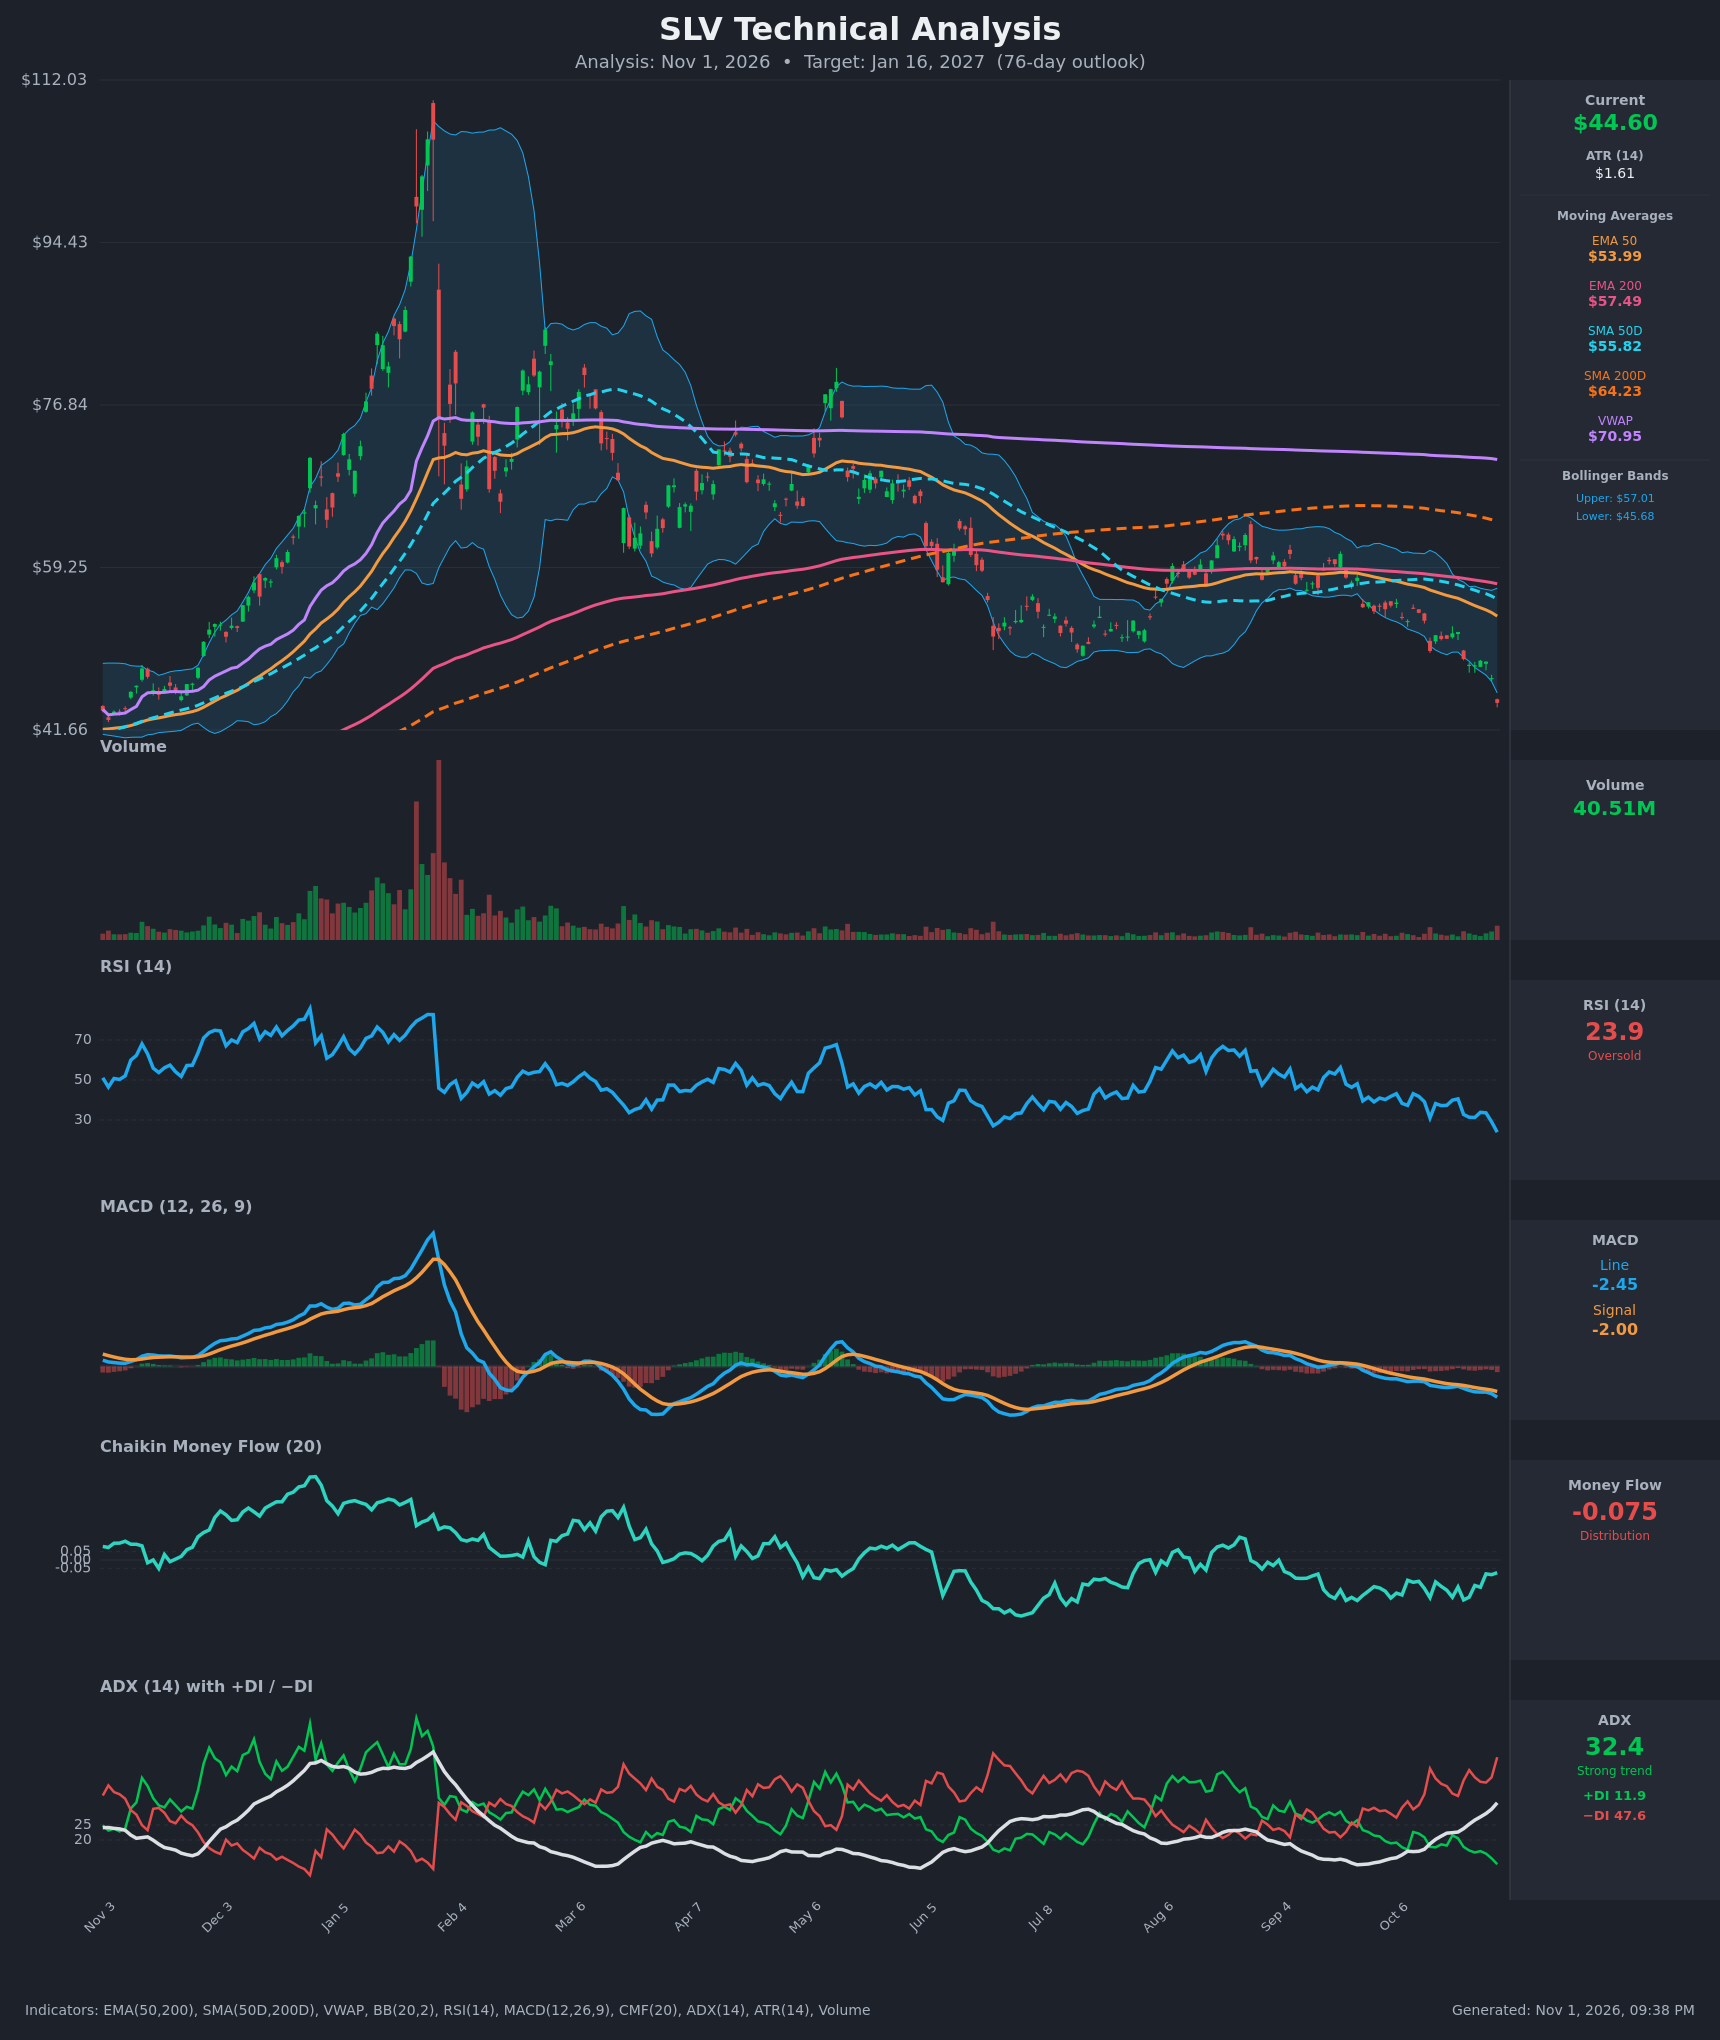
- RSI (14): 23.90, deeply oversold and falling sharply from 33.6 two sessions ago. It is making new lows with no bullish divergence yet. Oversold readings in a strong downtrend can persist, but a bounce is increasingly likely. [Bearish]
- 20 EMA: The 20 EMA is not provided. The 20-period Bollinger midline is about $51.34, and price at $44.60 is well below it. Price is also below the EMA50 ($53.99) and EMA200 ($57.49), so these act as overhead resistance. [Bearish]
- MACD: The line (-2.452) is below the signal (-1.998), and the gap is widening (histogram about -0.45). Both lines are falling and below zero, so there is no sign of a bullish crossover. [Bearish]
- Bollinger Bands (20): Price at $44.60 is below the lower band ($45.68), a band-walk breakdown. The bands are expanding downward. This is an extended, stretched condition that invites a mean-reversion bounce, but it also signals strong downside momentum. [Bearish]
- CMF (20): -0.075 is below -0.05, so there is mild distribution. It has been negative for the whole decline, though it is not extreme and is improving slightly from -0.237. [Distribution]
- ADX (14): 32.4 and rising, with -DI (47.6) far above +DI (11.9). This is a strong, accelerating downtrend with bears firmly in control. [Strong Trend - Bearish]
- Volume: 40.51M, a late uptick on the latest red candle. Volume is far below the January-February blow-off peak but rising on the breakdown. This looks like a continuation, with possible capitulation if volume expands further. [Bearish continuation / watch for capitulation]
DIVERGENCES & TRENDS
- There is no bullish RSI or MACD divergence. Both made new lows alongside price, which confirms the downtrend.
- A death cross has already occurred: SMA50D ($55.82) is below SMA200D ($64.23), and EMA50 ($53.99) is below EMA200 ($57.49). Price is below all moving averages and far below VWAP ($70.95), the signature of a long-term downtrend.
- MACD has been in a bearish alignment for weeks. The ADX has risen from 16 to 32 while -DI expanded from 32 to 48, so the trend is strengthening.
- Price broke the September-October lows near $47-48 and the $44-45 area. The next structural support is the early-November prior lows (about $41.66, the chart's left edge).
- The sell-off from the ~$112 peak is a roughly 60% decline. The most recent leg is steep, with a -$2.7 daily drop on Oct 30 (about 1.7x ATR).
CHART PATTERNS
- Since the parabolic top, the price has made lower highs and lower lows. The mid-year consolidation between about $50 and $62 resembles a Bearish Rising Wedge / Bearish Flag continuation that resolved lower. The breakdown below the wedge support (~$47-48) projects further downside.
- Measuring the consolidation range (~$12) down from the $48 breakdown gives a target near $36-38, though the current oversold extreme may delay it.
- No bullish reversal pattern (double bottom, inverse H&S, falling wedge) has formed yet.
- Overhead resistance is dense: the lower BB/prior support at $47-48, the $51 BB midline, and EMA50 at $54.
POTENTIAL SCENARIOS
- Scenario 1: Bearish Trend Continuation — The strong ADX/-DI trend and the breakdown below the lower band extend lower after a brief relief bounce. Trigger: failure to reclaim $47-48 and a close below $43.50. Target: $38-40. Invalidation: daily close above $51 (BB midline). (45% probability)
- Scenario 2: Bullish Oversold Mean-Reversion Bounce — RSI near 24 and price stretched below the bands drive a rebound toward the moving averages, but the bounce stays a bear-market rally. Trigger: a reclaim of $47.50 with a bullish MACD histogram turn. Target: $50-52. Invalidation: new low below $42. (30% probability)
- Scenario 3: Neutral Base Formation — Capitulation is followed by a sideways range between support and the lower band. Trigger: a volume spike with a hold above $41.66. Target: $42-48 range. Invalidation: a break outside the range with ADX above 30. (25% probability)
PRICE TARGETS
Timeframe: 76 days (the 61-180 day band calls for a width of ~18-30% of price).
- Target Price: $41.50 (modest downside, balancing trend continuation against oversold bounce risk)
- Expected Range: $35.00 to $49.50 (width $14.50, about 32.5% of the current price, wide enough for the 76-day horizon and elevated volatility)
- Key Levels: Support at $41.66, Resistance at $47.50
OVERALL BIAS
OVERALL BIAS: BEARISH - A strong, accelerating downtrend (ADX 32 with -DI at 47.6 versus +DI at 11.9), a death cross, price below all key moving averages and a bearish MACD all favor continued downside. Deeply oversold RSI raises the odds of a sharp bounce, so the target is only modestly below the current price.
This is educational analysis and not financial advice.