ARM 97-day bearish forecast — Nov 1, 2026
- Bias: Bearish
- Timeframe: 97 days (made Nov 1, 2026, target date Feb 5, 2027)
- Price at analysis: $205.97
- Price target: $187.00
- Expected range: $155.00 – $212.00
- Result: Pending — graded after the close on Feb 5, 2027
Get a free AI analysis of ARM today
Analysis
TECHNICAL INDICATORS
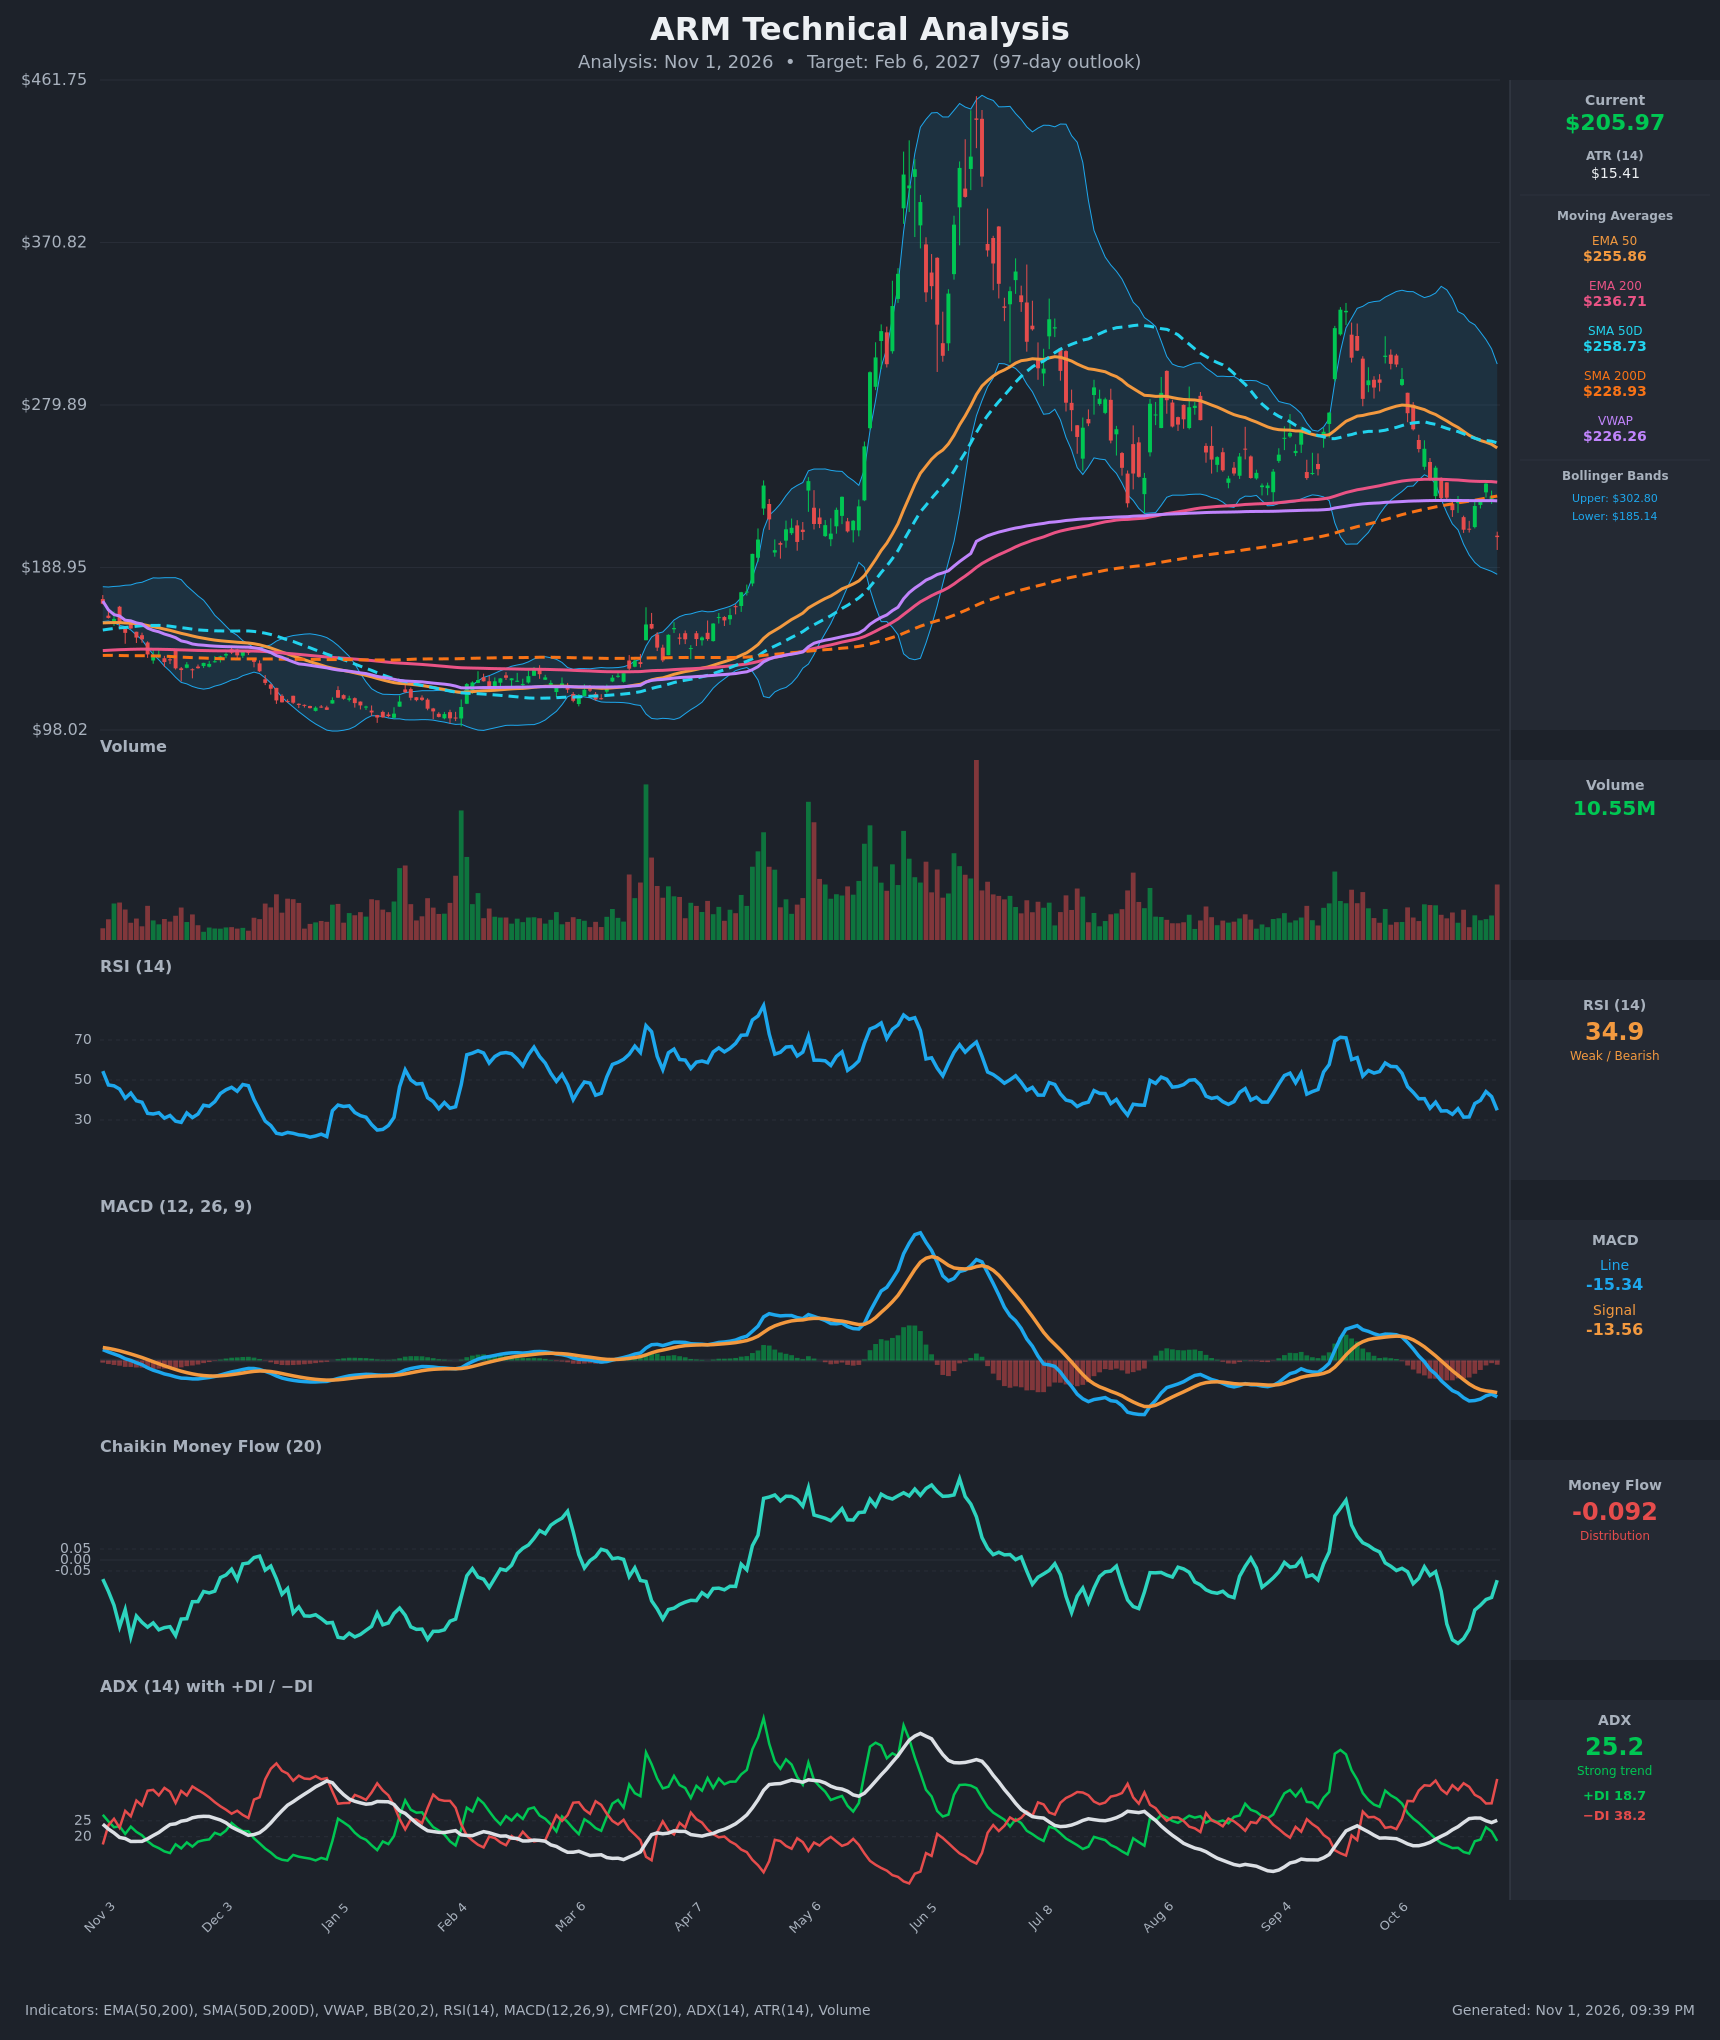
- RSI (14): 34.86, close to oversold but not there yet. It has made lower highs through the pullback, with a bounce to 44.2 on Oct 28 failing before the latest drop. Momentum is weak and still pointing down. [Bearish]
- 20 EMA: The 20 EMA value is not provided. Price ($205.97) is below the EMA 50 ($255.86) and the EMA 200 ($236.71), which act as overhead resistance. The EMA 50 is falling toward the EMA 200, and a bearish EMA crossover is approaching. [Bearish]
- MACD: Line -15.35 is below Signal -13.56, a negative histogram of about -1.8. The line crossed under the signal on Oct 16 and has stayed there. The Oct 26-28 bounce narrowed the gap, then the Oct 30 drop widened it again. Both lines are deep below zero. [Bearish]
- Bollinger Bands (20): Upper $302.80 and lower $185.14. Price sits in the lower third of the bands, about 11% above the lower band, and the bands are wide after the earlier volatility. A downward band walk would favor continuation, and a touch of $185 is a likely first test. [Bearish]
- CMF (20): -0.092, below the -0.05 threshold and negative for the last 15 sessions, with a low of -0.379 on Oct 21. That points to persistent distribution, and the small improvement from the low has not changed that. [Distribution]
- ADX (14): 25.2 and rising from 17 on Oct 12, so trend strength is building. -DI (38.2) is far above +DI (18.7), so sellers are firmly in control. [Strong Trend - Bearish]
- Volume: 10.55M on the latest bar, the highest in the recent stretch, and it came on a drop of about 10% ($228.77 to $205.97). A heavy-volume breakdown through the $210-$225 support zone suggests real selling and is not a low-volume drift. [Bearish - Heavy Selling]
Moving averages and VWAP:
- Price is below the SMA 200D ($228.93), the EMA 200 ($236.71) and VWAP ($226.26). Price is below its long-term trend line for the first time since the early-year base.
- The SMA 50D ($258.73) is still above the SMA 200D, so no death cross has formed. The gap is narrowing quickly and the SMA 50D is rolling over.
DIVERGENCES & TRENDS
- There is no meaningful bullish divergence. RSI made a lower high (44.2) on the Oct 28 bounce and a lower low in the 30s, which is in line with price. MACD is also making lower lows.
- The structure shows a lower high at roughly $335 in September versus the roughly $450 peak in June. Lower highs and lower lows are intact on the daily chart.
- The price broke below the SMA 200D and VWAP, which had held as a floor since spring. DI is bearish (−DI at 38.2 vs +DI at 18.7) and ADX is rising through 25.
- A bearish EMA 50/200 cross and a possible death cross are the next major signals, with the 50-day averages converging toward the 200-day averages. Right now all of this momentum points down.
- CMF has been negative since early October, even during the bounce, showing no real accumulation.
- The only offsets are RSI near 35 (a possible short-term bounce) and price approaching the lower Bollinger Band. These support a bounce but not a trend change.
CHART PATTERNS
- Descending triangle / support breakdown: Lower highs from the June peak (about $450) to about $335 in September press down on a horizontal support area around $210-$225 that was tested in July, August and October. Price has now closed below that area at $205.97. This matches the reference diagram's Descending Triangle, which is a bearish continuation. The full measured move (about $120 of pattern height) points toward the $100s, but I treat that as an extended, lower-probability target.
- Post-parabolic retracement: The advance from about $98 to about $461 has retraced more than 50%. The 61.8% level is near $237 and the 78.6% level is near $176. Price is below 61.8% and heading toward the 78.6% zone.
- Potential support zones: $185-$189 (lower Bollinger Band and prior horizontal level), then the $160-$175 area, then the March-May base around $130-$150.
POTENTIAL SCENARIOS
- Scenario 1: Bearish Continuation Lower — The support breakdown extends, with a first test of the lower Bollinger Band and then drift into the high $100s as ADX stays above 25 and -DI stays dominant. A death cross forms along the way. Trigger: daily close below $200 with sustained volume, and RSI dropping toward 30. Target: $185 first, then $160-$175. Invalidation: daily close back above $228.93 (SMA 200D) and VWAP ($226.26). (55% probability)
- Scenario 2: Bullish Oversold Relief Rally — Selling exhausts near $185 (lower band, RSI near oversold), the price recovers to retest the former support and the 200-day averages. Trigger: RSI turning up from the 30s, MACD histogram turning positive, and a reclaim of $228.93 on volume. Target: $228-$256 (EMA/SMA 50 zone). Invalidation: failure at $228-$237 with a lower high, or a close below $185. (30% probability)
- Scenario 3: Neutral Range Consolidation — Price bases between about $185 and $228 as ADX fades and the indicators reset. Trigger: ADX falling below 20 and RSI holding 35-50. Target: around $200-$215. Invalidation: close outside the $185-$228 range. (15% probability)
PRICE TARGETS
- Target Price: $187.00 (97-day, about -9% from current)
- Expected Range: $155.00 to $212.00 (width $57, about 27.7% of current price, in line with 18-30% for 61-180 days)
- Key Levels: Support at $185.14, Resistance at $226.26 (VWAP, with the SMA 200D at $228.93 just above)
OVERALL BIAS
OVERALL BIAS: BEARISH - The price has broken below all major moving averages and VWAP on its heaviest volume in weeks, with MACD negative, −DI (38.2) well above +DI (18.7) with ADX rising through 25, and CMF showing persistent distribution. Downside toward the $185 lower band and below is more likely than a reclaim of the $228 area, though an oversold bounce is possible along the way.
This is educational analysis and not financial advice.