GLD 97-day bearish forecast — Nov 1, 2026
- Bias: Bearish
- Timeframe: 97 days (made Nov 1, 2026, target date Feb 5, 2027)
- Price at analysis: $355.78
- Price target: $345.00
- Expected range: $312.00 – $392.00
- Result: Pending — graded after the close on Feb 5, 2027
Get a free AI analysis of GLD today
Analysis
TECHNICAL INDICATORS
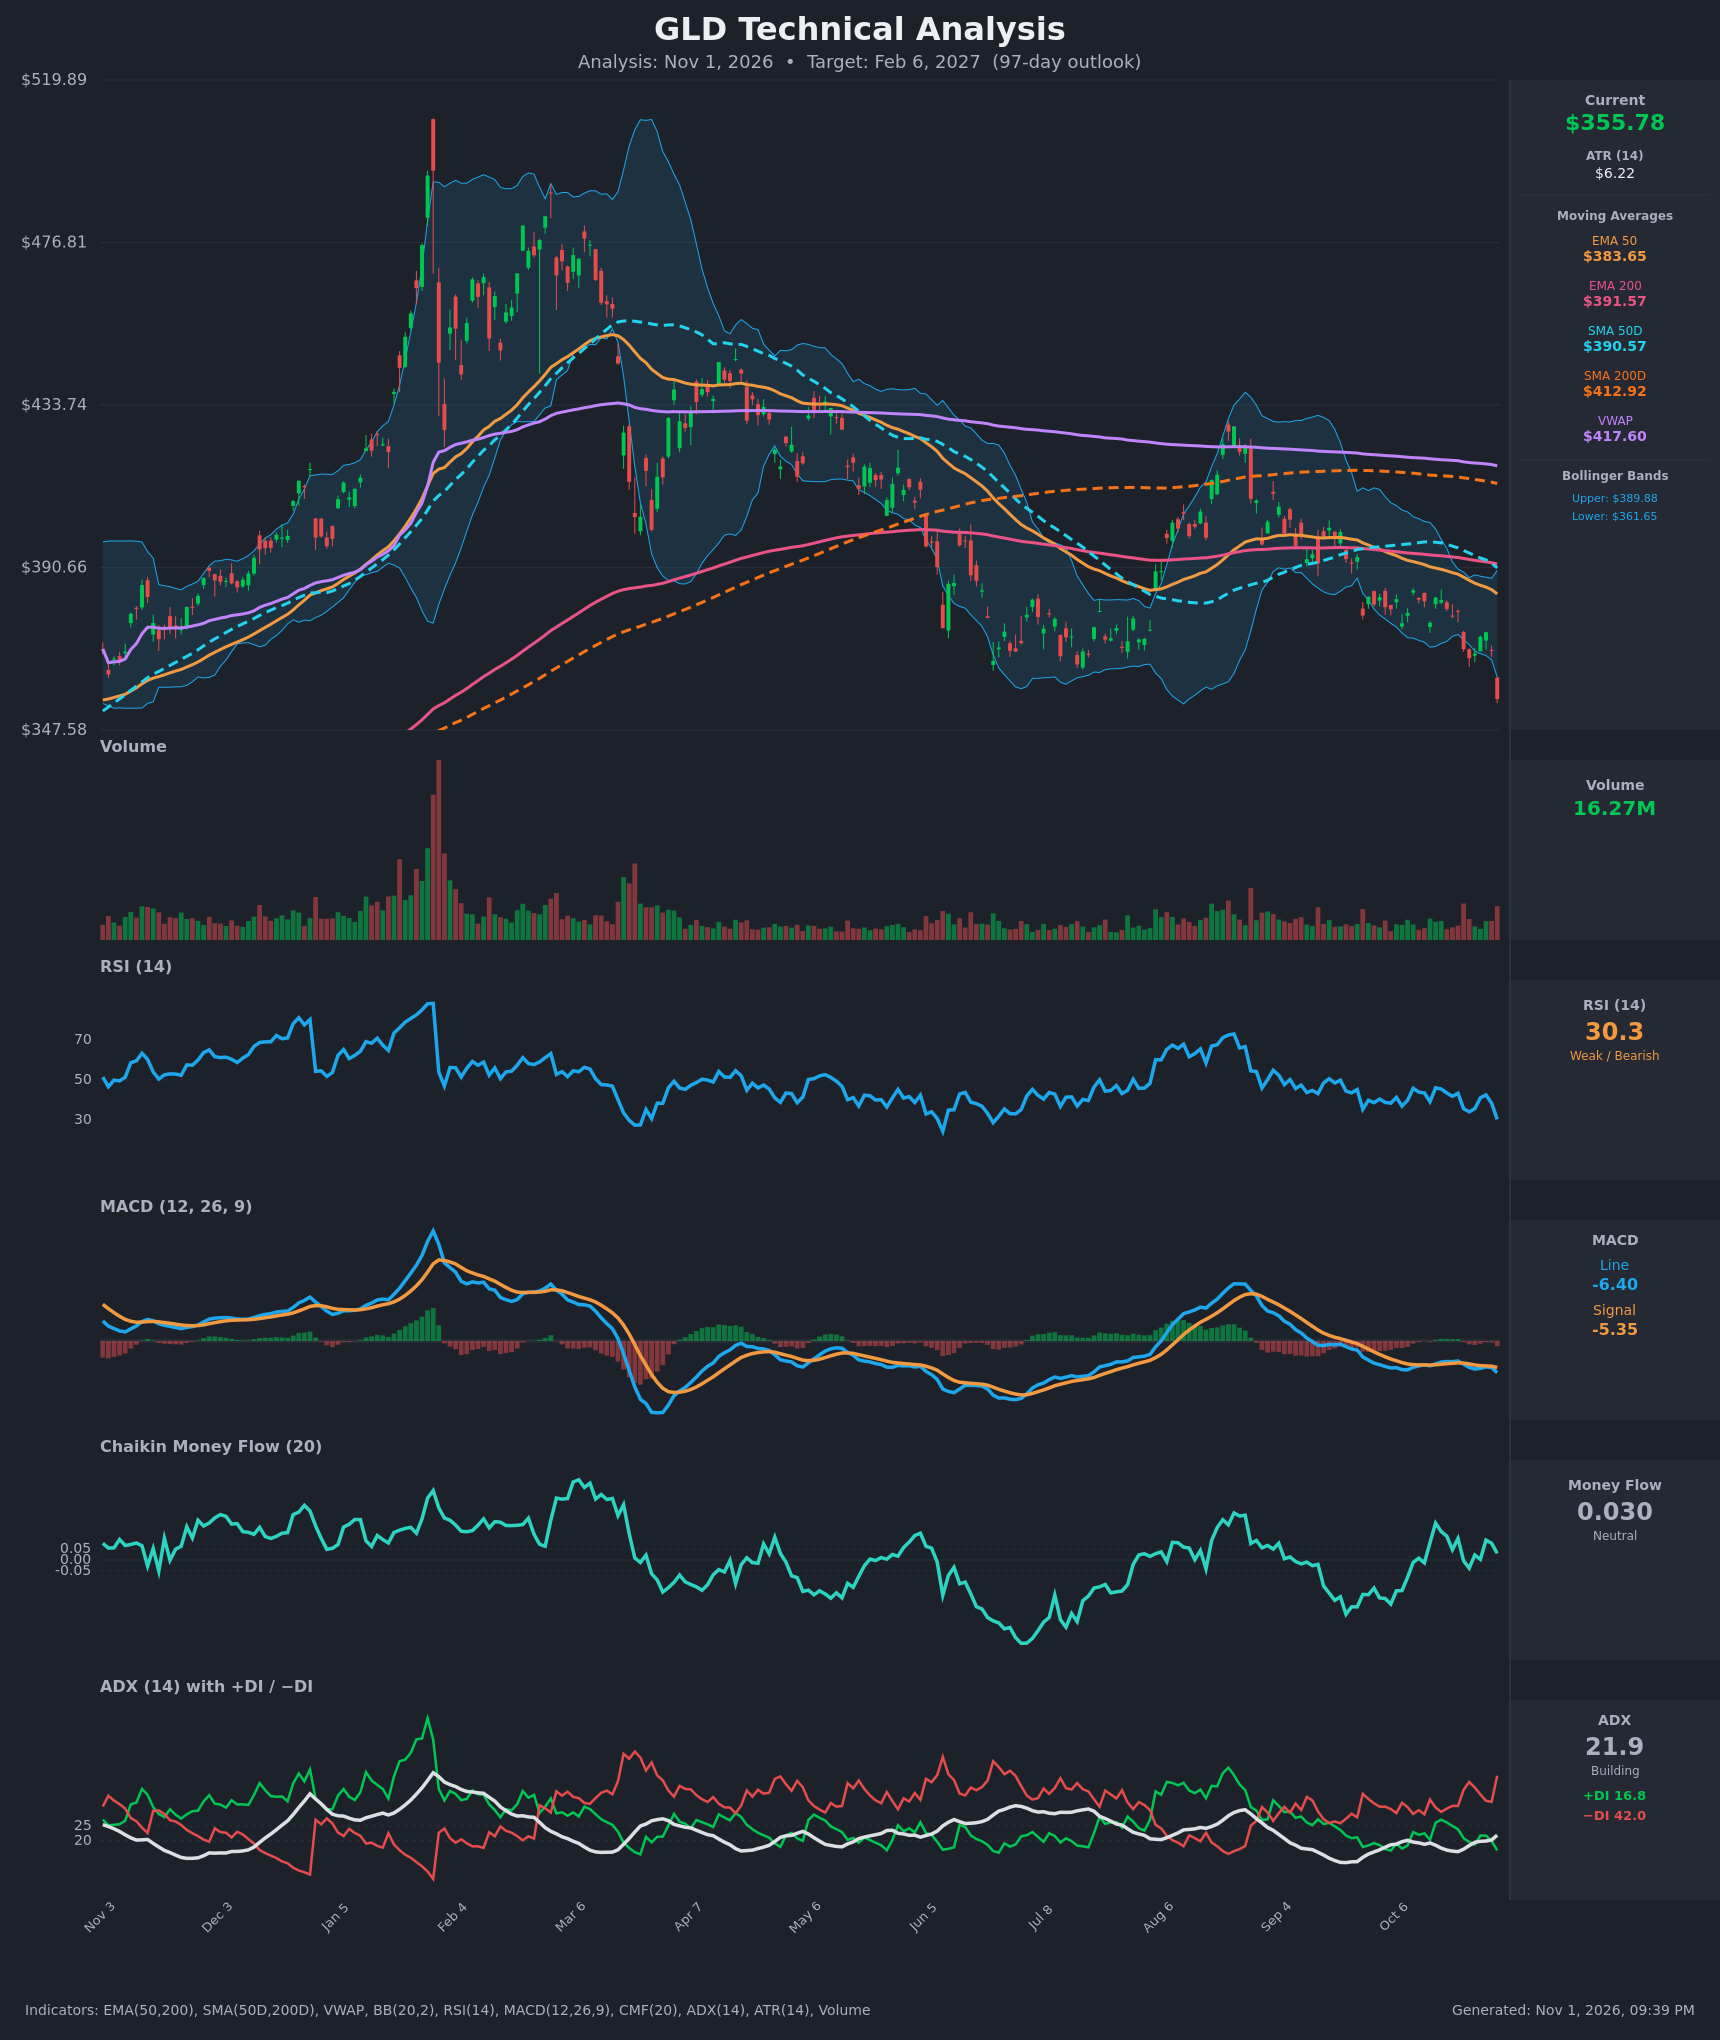
- RSI (14): 30.32, down from 38.5 the day before and 42.6 two days earlier. It sits at the oversold threshold, and the RSI low was only 25-30 at the June trough. Momentum is falling sharply, but a bounce is possible. [Bearish]
- 20 EMA: Not supplied. The 20-period Bollinger midline is roughly $375.8, and price at $355.78 is about 5% below it, so it acts as resistance. Against the supplied EMA 50 ($383.65) and EMA 200 ($391.57), price is well below both, and EMA50 is below EMA200 (bearish alignment). [Bearish]
- MACD: Line -6.40 is below signal -5.35, and the histogram is about -1.05 and widening. The line crossed below the signal on Oct 22-30 after a brief flat spell. Both lines are below zero and heading lower. [Bearish]
- Bollinger Bands (20): Upper $389.88, lower $361.65, with width of about $28 (about 7.9% of price). Price closed about $5.9 below the lower band, which is a band-walk and breakdown. The last candle is a large red bar piercing the band. Short-term it is stretched, but in a downtrend this reads as trend-confirming. [Bearish]
- CMF (20): 0.030, inside the ±0.05 neutral zone. It has hovered between -0.04 and +0.17 in the last 15 bars, so there is no clear accumulation or distribution and no strong dip-buying. [Neutral]
- ADX (14): 21.9 and rising (from 16.4 on Oct 21), with +DI 16.8 and −DI 42.0. Sellers are firmly in control, and the −DI/+DI spread of about 25 points is wide. Trend strength is building toward the 25 threshold. [Weak-but-building Trend, Bearish direction]
- Volume: 16.27M on the latest red bar, above the recent average (most of the last few months' bars were visibly smaller). The breakdown candle comes with elevated volume, which suggests real selling rather than a drift lower. [Bearish – expansion on breakdown]
DIVERGENCES & TRENDS
- No bullish RSI divergence yet. RSI is making a lower low in step with price, though RSI (30) is higher than the Jun low (~25) while price is at a new low, which could become a divergence if it holds.
- Death cross: SMA50D ($390.57) is below SMA200D ($412.92), and EMA50 ($383.65) is below EMA200 ($391.57). Both are established long-term bearish alignments. SMA50 is also converging toward EMA200, so the entire stack is sloping down.
- Price is below the SMA200 (-13.8%), the VWAP ($417.60, -14.8%), and all MAs, so the long-term trend is down.
- MACD histogram turned more negative on Oct 29-30, and the MACD line is making new lows for the current leg.
- DI: −DI has dominated +DI for nearly the whole period since Mar, with brief interruptions in Aug. The latest reading is the widest gap in weeks.
- Highs are stepping down: ~$520 (Jan-Feb) → ~$480 (Mar) → ~$440 (Aug) → ~$395-400 (Sep/Oct). Lows have been broken: the Jun-Jul base (~$365-370) and the Oct 23 low ($366.61) failed on Oct 30.
CHART PATTERNS
- Bearish Double Top / Head & Shoulders-like reversal (macro): The Jan-Mar peaks near $520 and $480-490 with a failed retest rally in Aug at about $440 form a lower-high sequence, which is a classic topping structure on the reference diagram. The Jun-Jul base (~$365-370) works as the neckline-like support, and it has now broken.
- Descending channel / Bearish Flag-type continuation: The Sep-Oct grind of small candles under the MAs, followed by a heavy red candle through the lower Bollinger Band, resembles the Bearish Flag Pattern continuation. The measured move from the Aug-Oct decline would imply a further drop of roughly $25-40, toward $325-340.
- Support from the chart's prior price history is thin below $350, so air-pockets are possible. The chart's low-axis marker is around $347.58.
POTENTIAL SCENARIOS
- Scenario 1: Bearish Trend Continuation — Price breaks below the Jun-Oct support band and continues lower with the death cross, −DI dominance, and a widening MACD gap, with ADX rising above 25. Bounces stall near the lower BB/EMA50 ($361-$384). Trigger: daily close below ~$347 with volume. Target: $330-$345, with an extension toward $315 in a flush. Invalidation: daily close back above $384 (EMA50). (52% probability)
- Scenario 2: Bullish Oversold Mean-Reversion Bounce — RSI at 30 and price well below the lower band produces a relief rally, as in the Jun and Aug rebounds. Price recovers to the declining averages but fails to reclaim the SMA200. Trigger: close above $362 (lower BB) followed by a MACD histogram turn. Target: $384-$392 (EMA50/SMA50 zone). Invalidation: a new low below $347. (33% probability)
- Scenario 3: Neutral Basing Range — Price stabilizes between $345 and $375 as ADX stays under 25 and CMF stays neutral. Trigger: repeated holds of $347-$350 support with tight candles. Target: $350-$372. Invalidation: close outside $345-$385. (15% probability)
PRICE TARGETS
- Target Price: $345.00 (97 days, Feb 6, 2027)
- Expected Range: $312.00 to $392.00. The width is $80, or about 22.5% of the current price, consistent with the 61-180 day guidance (18-30%).
- Key Levels: Support at $347.00, Resistance at $361.65
OVERALL BIAS
OVERALL BIAS: BEARISH - Price is at its lowest in the chart window, well below every moving average, with a death cross, −DI (42.0) far above +DI (16.8), a bearish MACD, a close below the lower Bollinger Band, and breakdown volume. The oversold RSI (30) raises the odds of a relief bounce, but it does not outweigh the structural downtrend.
This is educational analysis and not financial advice.