MSTR 97-day bearish forecast — Nov 1, 2026
- Bias: Bearish
- Timeframe: 97 days (made Nov 1, 2026, target date Feb 5, 2027)
- Price at analysis: $130.51
- Price target: $118.00
- Expected range: $102.00 – $136.00
- Result: Pending — graded after the close on Feb 5, 2027
Get a free AI analysis of MSTR today
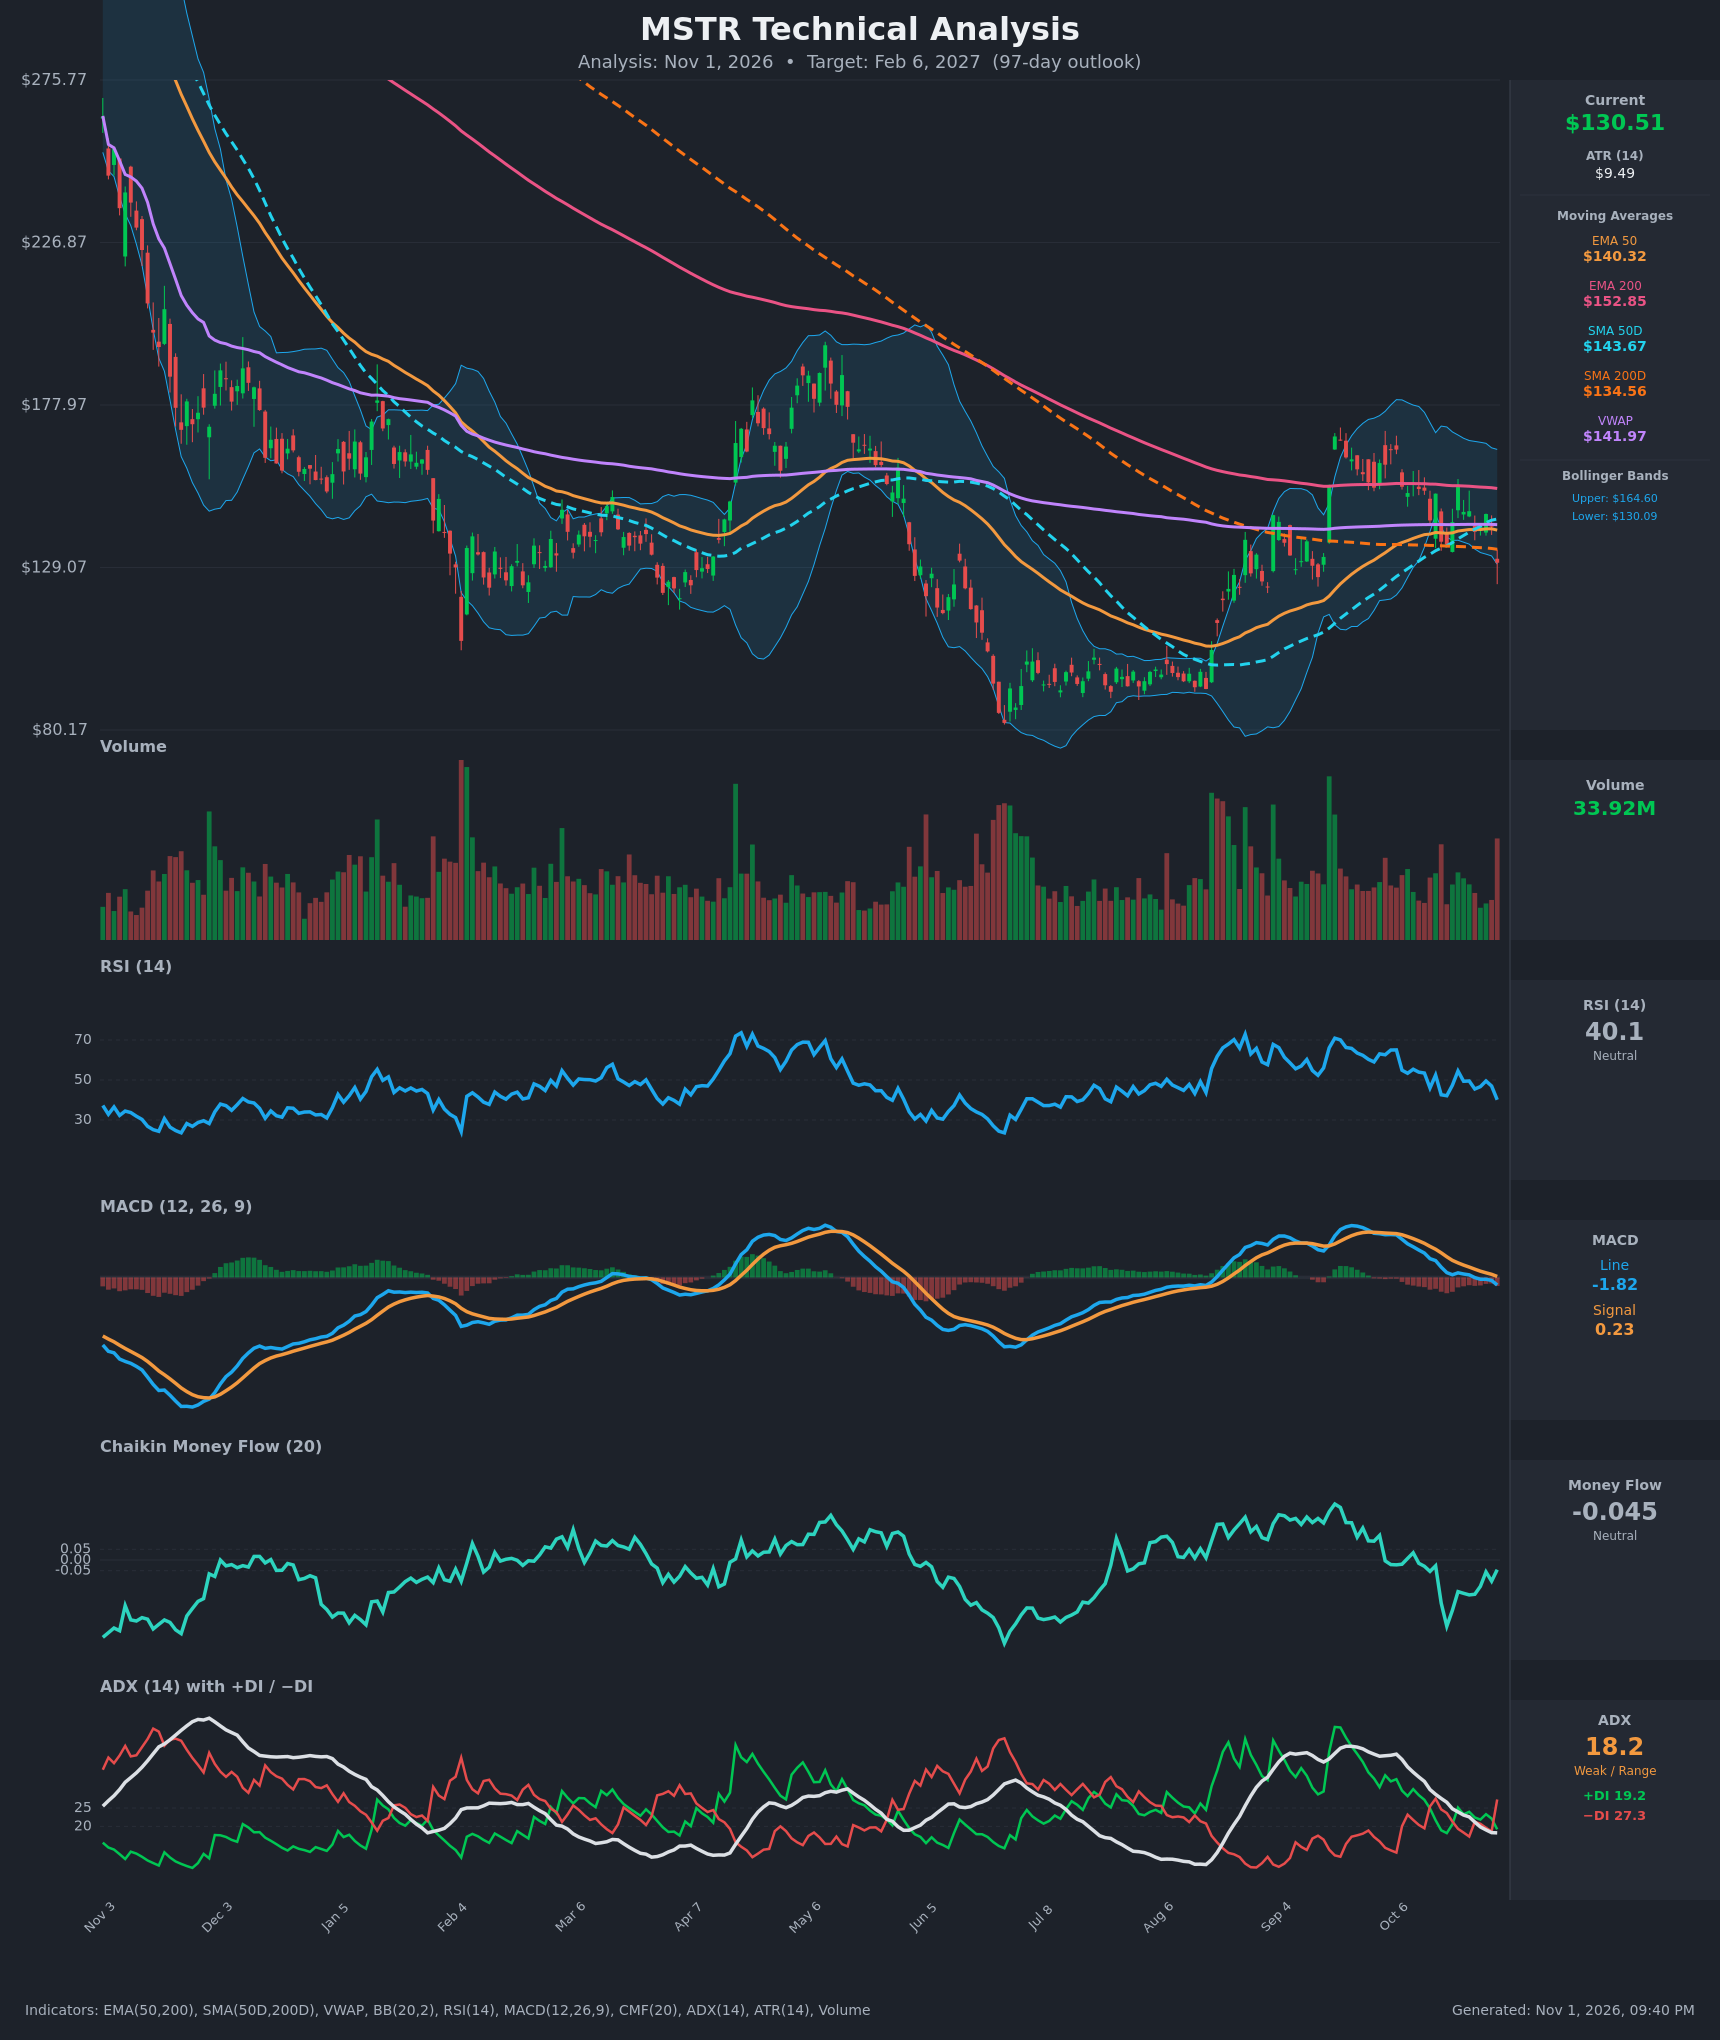
Analysis
TECHNICAL INDICATORS
- RSI (14): 40.11, down from 54.5 on Oct 21 and falling toward the 30–40 zone. It is not yet oversold, so there is room for more downside before a momentum washout. [Bearish]
- 20 EMA: No 20 EMA value was provided, so I use the EMA 50 at $140.32. Price at $130.51 is about 7% below it, and the EMA 50 is now flattening and turning down. It also sits below the EMA 200 ($152.85), so the longer-term EMA structure is bearish. Both act as overhead resistance. [Bearish]
- MACD: The line (-1.82) crossed below the signal (0.23) around Oct 26. The histogram is negative (about -2.05) and widening. The line has also gone below zero, a momentum shift after the September peak. [Bearish]
- Bollinger Bands (20): Price ($130.51) is pressed against the lower band ($130.09), with the upper band at $164.61. The wide band suggests elevated volatility. A close at the lower band in a weak-ADX, downward-sloping environment can mean either a bounce or a "band walk", and the −DI dominance and MACD favor continuation. [Bearish]
- CMF (20): -0.045 is inside the neutral zone, but it has been negative since mid-October (low near -0.31) and has not recovered above +0.05. Volume flow is mildly distributive. [Neutral]
- ADX (14): 18.2 and falling, so there is no strong trend. −DI (27.3) has jumped above +DI (19.2), a fresh bearish DI crossover. The trend is weak but the direction now favors the bears. [Weak Trend + Bearish direction]
- Volume: 33.92M on the latest bar, a red bar and one of the heaviest in recent weeks. That points to a high-volume breakdown from the Sept–Oct range. [Bearish – selling pressure]
DIVERGENCES & TRENDS
- Price made lower highs at about $205 (May), $175 (Sept) and $153 (Oct), while RSI also peaked lower each time (about 73, 72, 61). This is confirmation, not divergence.
- There is no bullish divergence yet. RSI at 40 is not at an extreme, and the MACD histogram is still deepening.
- The price closed below SMA200D ($134.56) for the first time since the August recovery, a loss of the long-term trend line. SMA50D ($143.67) is still above SMA200D, but it is flattening and the gap is narrowing. A death cross is possible within the 97-day window if weakness persists.
- Price is below VWAP ($141.97), EMA 50 and EMA 200, and the lower Bollinger Band has been touched.
- The EMA 50 is below the EMA 200, so the larger EMA structure is bearish.
- The −DI/+DI flip, the MACD bearish cross and the RSI break below 50 all happened within about a week.
CHART PATTERNS
- Bearish Double Top / Lower-high structure: The Sept (~$175) and Oct (~$153) rallies failed below the declining EMA 200. The most recent bounce was about $153, and the neckline of the Sept–Oct range sits around $130–135. The latest close breaks below it.
- Range breakdown (Bearish Triple Top-style): Repeated rejections at $145–155 with a break of the $130 support suggest the measured move is the range height. The range is about $155 to $130, or $25, which projects to roughly $105.
- The earlier Aug–Sept base ($95–100) is the major demand zone and the likely ultimate target if the breakdown extends. The Feb–Apr lows ($103–117) are intermediate support.
POTENTIAL SCENARIOS
- Scenario 1: Bearish Range Breakdown Continuation — Price loses the $130 band and SMA200D area, and sellers keep control (−DI > +DI, negative MACD). Price slides through the $117 prior-low zone toward the $100–105 area. Trigger: daily close below $128 with volume. Target: $117 first, then $102–105. Invalidation: close back above $141 (EMA 50/VWAP). (50% probability)
- Scenario 2: Neutral Oversold Bounce and Range — The lower Bollinger Band and weak ADX produce a relief bounce back to the $134–145 area, followed by chop under the declining EMA 200. Trigger: reclaim of $134.56 (SMA200D) on a rising CMF. Target: $138–145. Invalidation: close below $122. (28% probability)
- Scenario 3: Bullish Reversal — Price reclaims the EMA 50 and VWAP, MACD re-crosses, and the stock returns to the $153–165 resistance. Trigger: close above $142 with +DI crossing back above −DI. Target: $153, then $165 (upper Bollinger Band). Invalidation: failure at $145 or a close below $125. (22% probability)
PRICE TARGETS
- Target Price: $118.00 (97-day horizon)
- Expected Range: $102.00 to $136.00. The width is $34, or about 26% of the current price, which fits the 61–180 day guidance of 18–30%.
- Key Levels: Support at $117.00, Resistance at $134.56
OVERALL BIAS
OVERALL BIAS: BEARISH - Price has broken below the Sept–Oct range and SMA200D, sits at the lower Bollinger Band on heavy selling volume, and has a bearish MACD cross, a bearish DI flip and a falling RSI. Lower highs under the declining EMA 200 favor a move toward $117 and possibly the $100–105 area.
This is educational analysis and not financial advice.