IREN 97-day bearish forecast — Nov 1, 2026
- Bias: Bearish
- Timeframe: 97 days (made Nov 1, 2026, target date Feb 5, 2027)
- Price at analysis: $23.95
- Price target: $21.00
- Expected range: $18.00 – $25.00
- Result: Pending — graded after the close on Feb 5, 2027
Get a free AI analysis of IREN today
Analysis
TECHNICAL INDICATORS
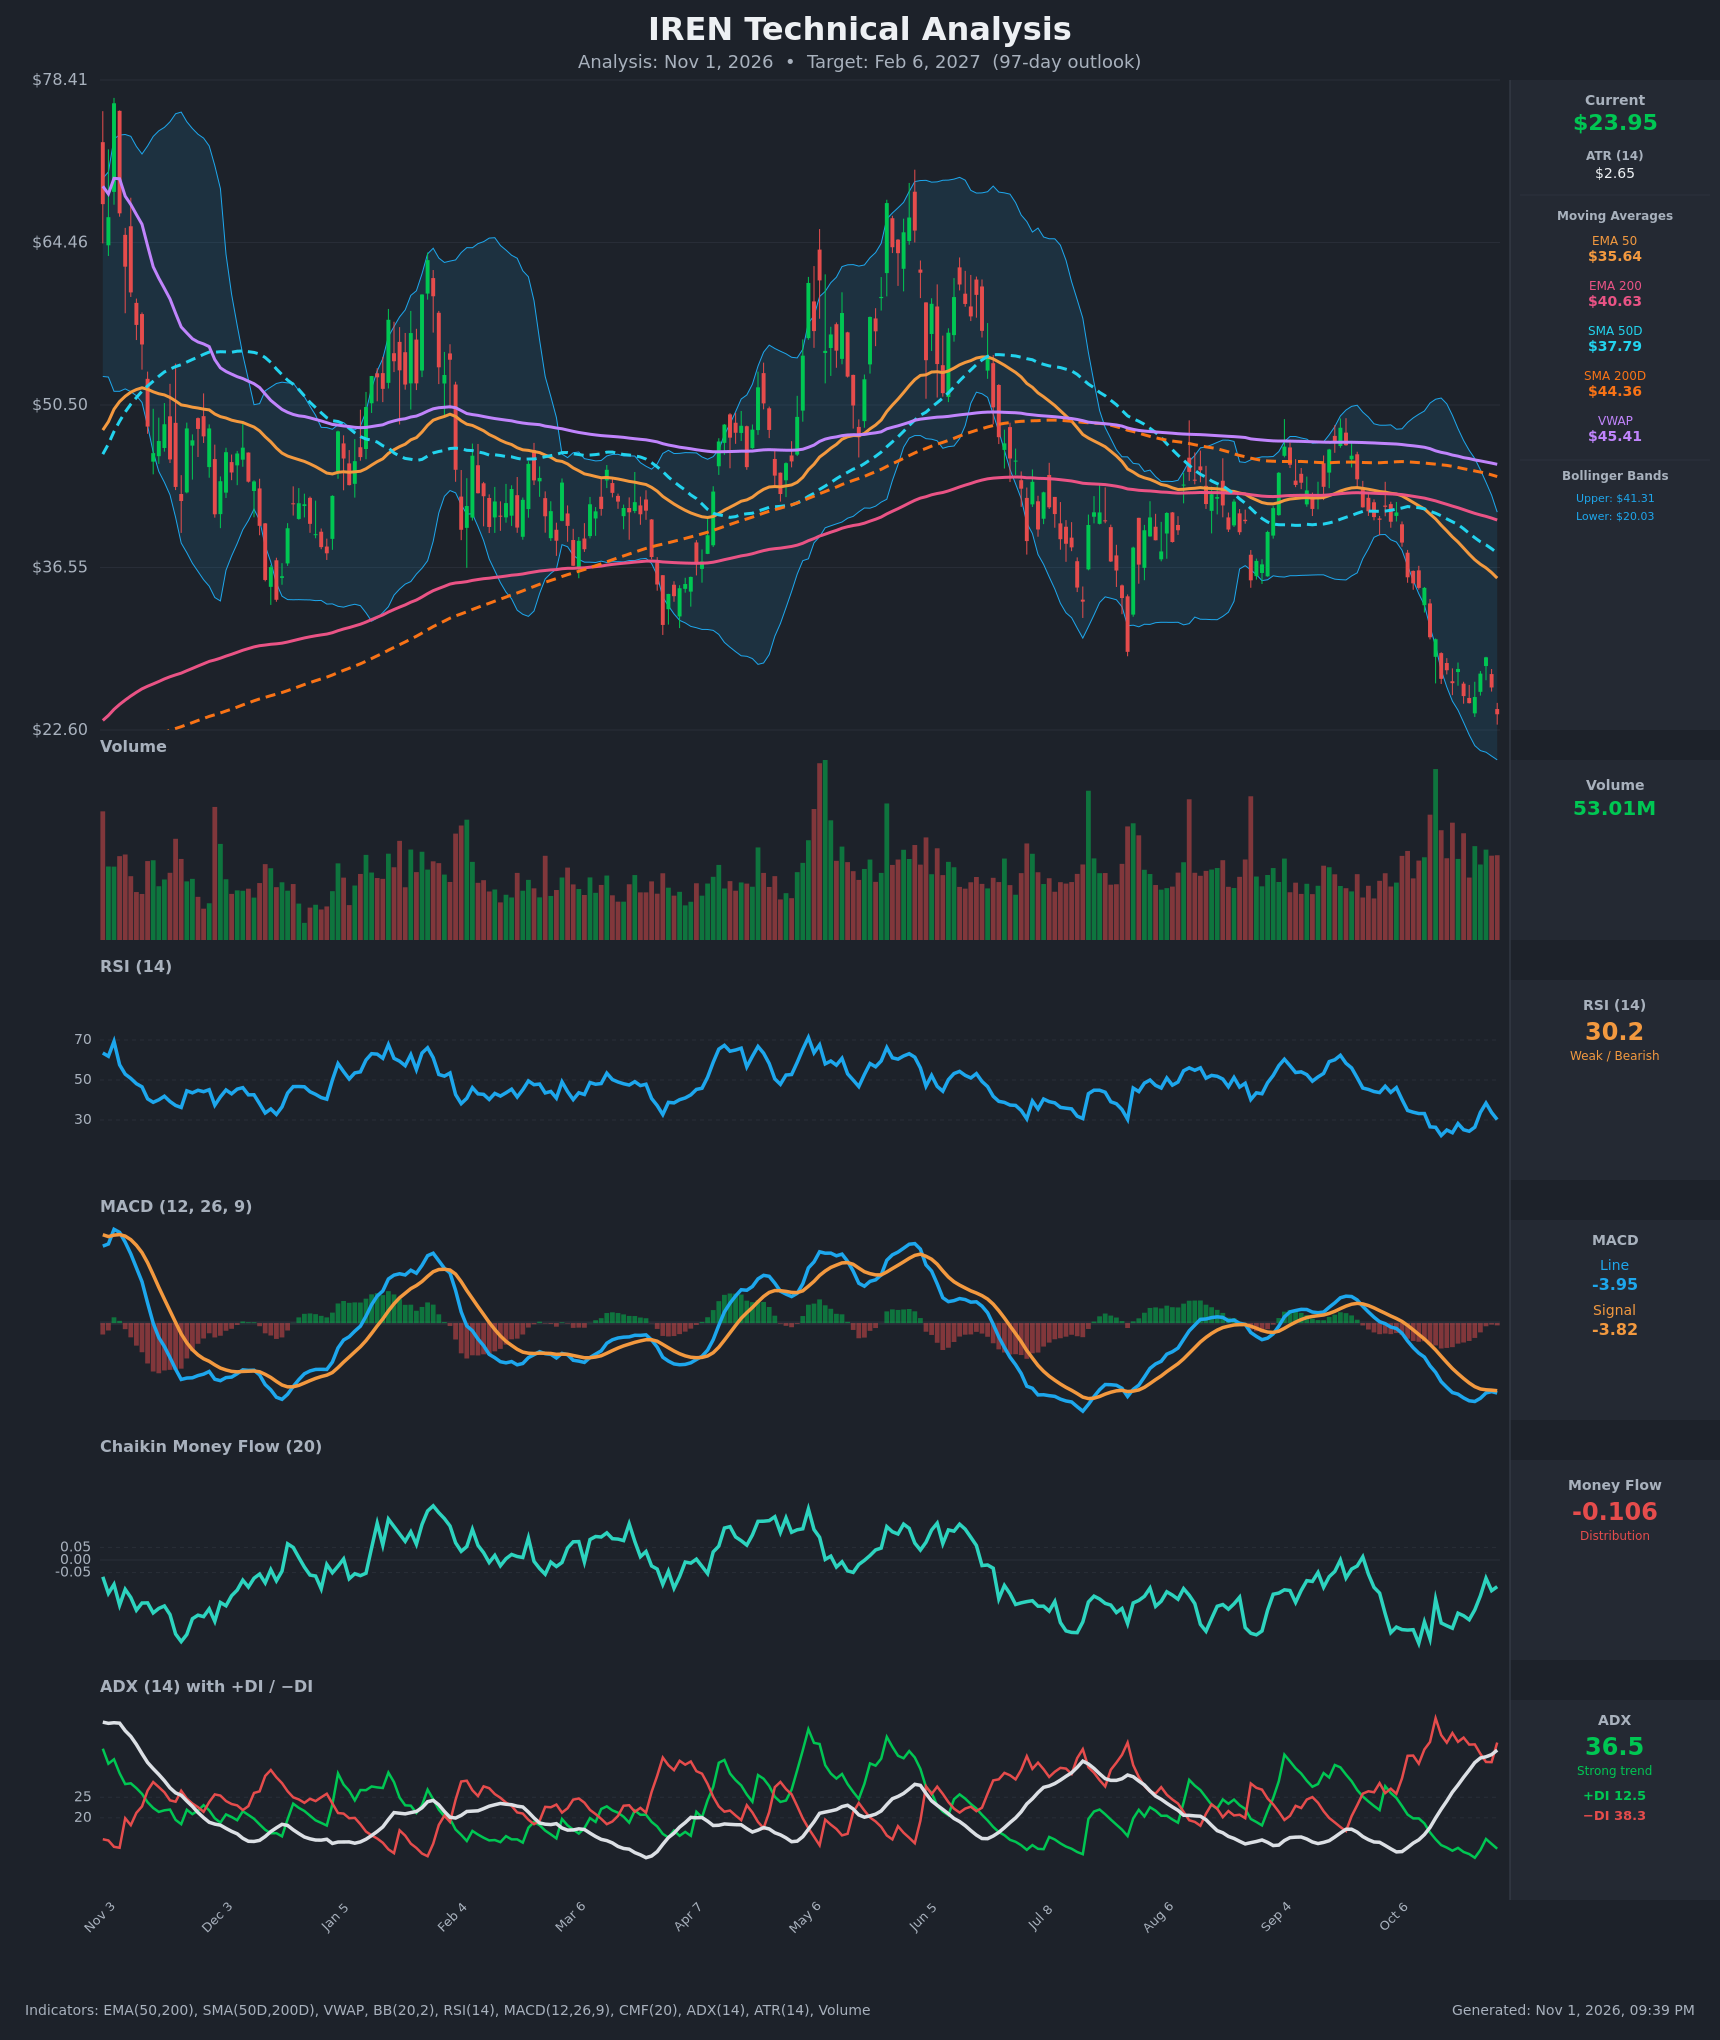
- RSI (14): 30.20, right at the oversold threshold and rebounding off a 22.2 low on Oct 16. It has sat in the 22–38 zone for about 3 weeks, which shows persistent selling pressure. Momentum is weak, with only a brief bounce to 38.4 on Oct 28 before rolling over again. [Bearish]
- 20 EMA: The 20 EMA isn't supplied. The EMA 50 is $35.64 and falling, about 33% above price, and the EMA 200 is $40.63. Price is far below both, so they act as heavy overhead resistance. A close below the 20-period average is implied by the recent lower highs. [Bearish]
- MACD: Line -3.95 vs Signal -3.82, so the line is below the signal with a small negative histogram (about -0.13). The brief histogram narrowing to -0.02 on Oct 28 has reversed and is widening again. Both lines sit deep below zero. [Bearish]
- Bollinger Bands (20): Upper $41.31, lower $20.03, with price at $23.95 in the lower third of the bands. The bands are wide, which shows high volatility. Price hugged the lower band during the Oct 22–26 low and was rejected at the mid-band area on the bounce. The lower band at about $20 is the next volatility-based floor. [Bearish]
- CMF (20): -0.106, below the -0.05 threshold. It has been negative for most of the past 6 months and has not recovered above zero. It improved from -0.33 to -0.07 but has turned back down. [Distribution]
- ADX (14): 36.5 and rising from 14.7 two weeks ago, with -DI (38.3) far above +DI (12.5). This is a strong, accelerating downtrend with bears firmly in control. [Strong Trend – Bearish]
- Volume: 53.01M, elevated relative to the quieter mid-year periods. The selloff has come on heavy volume, with large red bars in late October, which looks like distribution and capitulation-style participation. No volume-confirmed reversal bar has appeared yet. [Bearish – heavy selling volume]
DIVERGENCES & TRENDS
- Mild bullish RSI divergence: Price made lower lows ($26.99 → $24.91 → $23.95) while RSI rose (22.2 → 24.4 → 30.2). This hints at fading downside momentum, but it needs price confirmation.
- MACD: It is still making lower lows (-4.43 trough, now -3.95) and sits below the signal line with no bullish cross. This confirms the downtrend.
- Death cross is already in place: SMA50D ($37.79) is below SMA200D ($44.36), and EMA50 ($35.64) is below EMA200 ($40.63). Both gaps are widening.
- VWAP: At $45.41, VWAP is about 90% above price, which indicates sustained selling pressure. The long-term trend is down, with price well below the SMA200D.
- ADX/DI: -DI has dominated since mid-October and ADX is now above 25 and climbing, which is a classic strong-trend confirmation.
- Trend: Lower highs and lower lows since the June peak near $70, and a steep drop from about $45 to about $24 in 3 weeks.
CHART PATTERNS
- Descending staircase / Bearish Flag-like consolidation (Oct 19–29): After the sharp drop from about $35 to $27, price consolidated in a small $25–$29 range and broke lower, which fits the Bearish Flag/Pennant continuation pattern. The measured move (flagpole of about $8 from $35 to $27) projects roughly $19–$21 from the flag breakdown.
- Larger context: Since the June high, price has formed a broad descending structure of lower highs ($70 → $50 → $43 → $29) with lower lows, resembling a large Descending Triangle/Rising-Wedge breakdown sequence. The Aug–Sep consolidation near $40–$45 broke down, consistent with bearish continuation.
- Possible bullish element: There is a tentative Bullish Double Bottom or Falling Wedge at $23–$25 on the daily chart, but it is unconfirmed. It would need a close above about $29 (the Oct 28 high) to validate.
POTENTIAL SCENARIOS
- Scenario 1: Bearish Trend Continuation — The strong ADX/−DI trend, distribution (CMF), and the flag breakdown pull price toward the lower Bollinger Band and the measured-move zone, with only weak, sell-able bounces into the falling EMA 50. Trigger: daily close below $23.00 (the recent low zone) on above-average volume. Target: $19.00–$21.00. Invalidation: daily close above $29 (the Oct 28 swing high). (50% probability)
- Scenario 2: Bullish Oversold Relief Rally — RSI divergence and the oversold reading spark a mean-reversion bounce toward the declining moving averages and prior breakdown levels. Trigger: reclaim of $27.50–$28.80 with a MACD bullish cross and CMF rising above 0. Target: $30–$35 (the EMA 50 area, about $35, as a ceiling). Invalidation: a close below $20 (lower BB) negates the bounce. (35% probability)
- Scenario 3: Neutral Base Building — Price stabilizes between roughly $20 and $28 as selling exhaustion offsets weak demand. Trigger: ADX rolling over below 25 and volume drying up. Target: $22–$27. Invalidation: a close outside the $19–$29 range. (15% probability)
PRICE TARGETS
For the 97-day horizon (to about Feb 6, 2027), I expect the strong downtrend to extend, though a volatile relief bounce is plausible along the way. The range is skewed but kept at roughly 29% of price, in line with the 61–180 day guidance (width $7.00 / $23.95 ≈ 29%).
- Target Price: $21.00 (97 days)
- Expected Range: $18.00 to $25.00
- Key Levels: Support at $20.03 (lower Bollinger Band), Resistance at $28.84 (Oct 28 swing high; the EMA 50 at $35.64 is the next major hurdle)
OVERALL BIAS
OVERALL BIAS: BEARISH - ADX is 36.5 and rising with −DI far above +DI, price sits well below every moving average after a death cross, MACD is below its signal, and CMF shows distribution on heavy volume. The RSI divergence and oversold reading raise the risk of a relief bounce, but they don't yet outweigh the trend evidence.
This is educational analysis and not financial advice.