MARA 97-day bearish forecast — Nov 1, 2026
- Bias: Bearish
- Timeframe: 97 days (made Nov 1, 2026, target date Feb 5, 2027)
- Price at analysis: $6.77
- Price target: $6.10
- Expected range: $5.30 – $7.20
- Result: Pending — graded after the close on Feb 5, 2027
Get a free AI analysis of MARA today
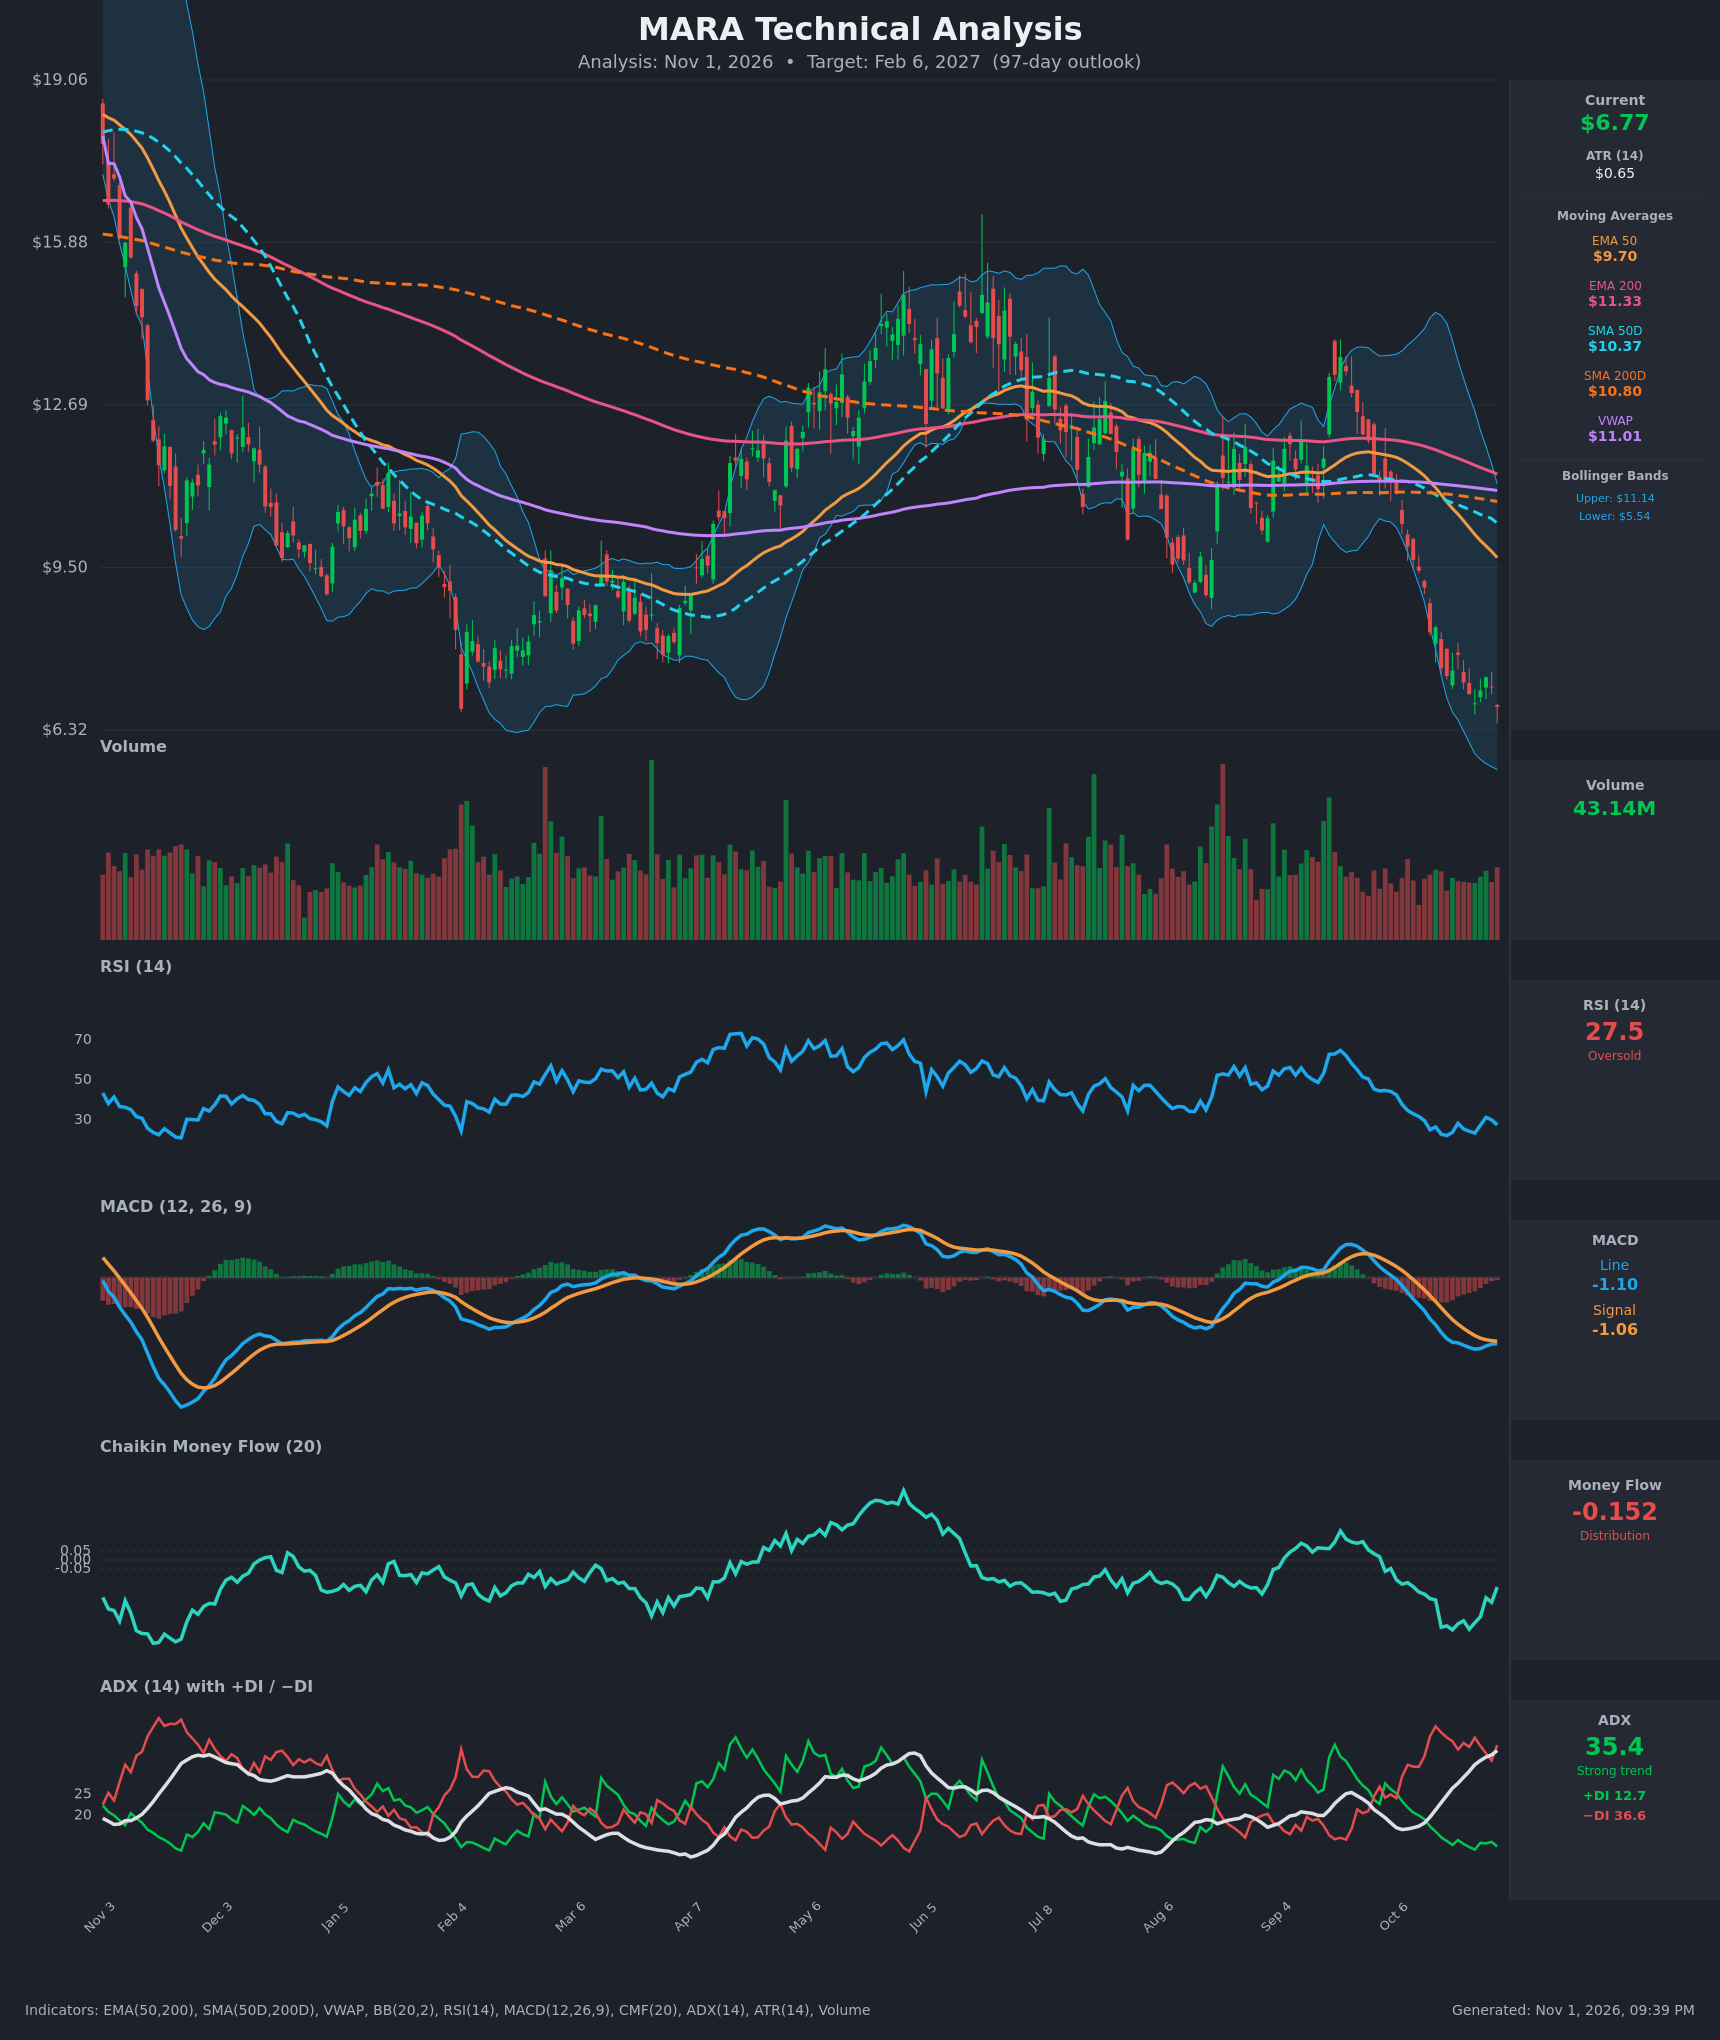
Analysis
TECHNICAL INDICATORS
- RSI (14): 27.55, oversold. It has stayed between about 22 and 31 for the last 15 bars and made no new low on the Oct 30 drop (22.2 on Oct 19 was the trough). That is a minor bullish hint, but momentum is still depressed and below 30. [Bearish]
- 20 EMA: The 20 EMA value was not provided. Using the supplied EMA 50 at $9.70 (falling every bar) and EMA 200 at $11.33, price at $6.77 sits about 30% below the EMA 50. Both slope down, and EMA 50 is below EMA 200 (bearish alignment). The averages act as heavy overhead resistance. [Bearish]
- MACD: Line -1.0985 is below Signal -1.0567, and the histogram is slightly negative (about -0.04). The line and signal are flattening and nearly converged after a deep decline, so a bullish crossover is possible soon. There is no confirmed cross yet. [Bearish]
- Bollinger Bands (20): Upper $11.14, lower $5.54, and the middle band is about $8.34. Price at $6.77 is in the lower third, about 22% of the band width above the lower band. The bands are wide, which shows high volatility, and price has been walking the lower half. [Bearish]
- CMF (20): -0.152, below -0.05, so distribution persists. It has recovered from -0.39 (Oct 20-23) to -0.15, so selling pressure is easing but has not turned to accumulation. [Distribution]
- ADX (14): 35.4 and rising steadily from 17.5, with −DI 36.6 well above +DI 12.7. This is a strong, accelerating downtrend with bears in full control. [Strong Trend – Bearish]
- Volume: 43.14M, roughly average to slightly below average and not capitulatory. The decline from $9.44 to $6.77 came on steady rather than climaxing volume, so there is no obvious selling-exhaustion spike. [Neutral-to-Bearish: no capitulation signal]
DIVERGENCES & TRENDS
- Divergences: There is no clean bullish RSI divergence. RSI made a higher low (27.5 vs 22.2) while price made a lower low ($6.77 vs $7.38). That is a mild early divergence, but it is not confirmed. MACD momentum is also flattening while price falls.
- Trend: Price is below every moving average: EMA 50 ($9.70), EMA 200 ($11.33), SMA 50D ($10.37), SMA 200D ($10.80) and VWAP ($11.01). Price has fallen from about $15 in early June to $6.77.
- Crossovers: A death cross is in place, with SMA 50D below SMA 200D. EMA 50 is below EMA 200, and the −DI/+DI gap has stayed wide since mid-October. MACD is below its signal, with a possible cross-up building.
- Support break: Price has pushed to the lowest levels on the chart, below the Feb-Mar base of about $6.6-$9.5. That base failed as support.
CHART PATTERNS
- Bearish Flag / Pennant (continuation): The sharp drop from about $9.4 to $7.4, followed by the weak Oct 21-29 bounce in a small channel and a rollover back to $6.77, resembles a bearish flag. The measured move is the pole (about $2.0-$2.2) projected from the breakdown near $7.2, giving about $5.0-$5.5, near the lower Bollinger Band ($5.54).
- Broader structure: The June peak near $16 with lower highs since (about $13.5 in Sep) and a loss of the Feb-Mar base is a bearish structure. It is not a clean Head and Shoulders.
- Counter-pattern risk: The Feb-Mar area saw a bullish reversal from similar oversold readings. Price is now retesting that zone, so a Bullish Double Bottom or Falling Wedge-style bounce is possible. It would need a reclaim of about $7.80 to confirm.
POTENTIAL SCENARIOS
- Scenario 1: Bearish Trend Continuation — Strong ADX with −DI dominance and a bearish flag breakdown keep price grinding lower, with only weak oversold bounces that fail below the EMA 50. Trigger: daily close below $6.40 (recent swing low). Target: $5.50-$5.54 (lower Bollinger Band / flag measured move), possibly $5.00 in an extension. Invalidation: daily close above $7.80, then above $9.70. (50% probability)
- Scenario 2: Bullish Oversold Mean-Reversion Bounce — RSI below 30, a MACD bullish cross, and improving CMF spark a relief rally, as happened off the Feb-Mar lows. Trigger: MACD cross-up with a close above $7.35-$7.80. Target: $8.30 (Bollinger midline), with $9.70 (EMA 50) as the stretch target. Invalidation: close below $6.40. (35% probability)
- Scenario 3: Neutral Basing Range — Price stabilizes and chops between about $5.80 and $7.60 as selling momentum fades. Trigger: ADX rolls over below 30 with price holding $6.40. Target: $6.50-$7.00. Invalidation: close outside $5.50-$7.80. (15% probability)
PRICE TARGETS
- Target Price: $6.10 (97-day, Feb 6, 2027)
- Expected Range: $5.30 to $7.20 (width $1.90, about 28% of the current price, within the 18-30% guidance for 61-180 days)
- Key Levels: Support at $6.40 (recent swing low), with $5.54 (lower Bollinger Band) below it. Resistance at $7.80 (Oct 21 swing close), then $9.70 (EMA 50).
OVERALL BIAS
OVERALL BIAS: BEARISH - A strong and rising ADX (35.4) with −DI far above +DI, a death cross, price below all key averages, and persistent CMF distribution outweigh the oversold RSI (27.55). The oversold reading and flattening MACD make a relief bounce likely along the way, but the expected 97-day path remains lower.
This is educational analysis and not financial advice.