NIO 97-day bearish forecast — Nov 1, 2026
- Bias: Bearish
- Timeframe: 97 days (made Nov 1, 2026, target date Feb 5, 2027)
- Price at analysis: $3.21
- Price target: $3.00
- Expected range: $2.60 – $3.40
- Result: Pending — graded after the close on Feb 5, 2027
Get a free AI analysis of NIO today
Analysis
TECHNICAL INDICATORS
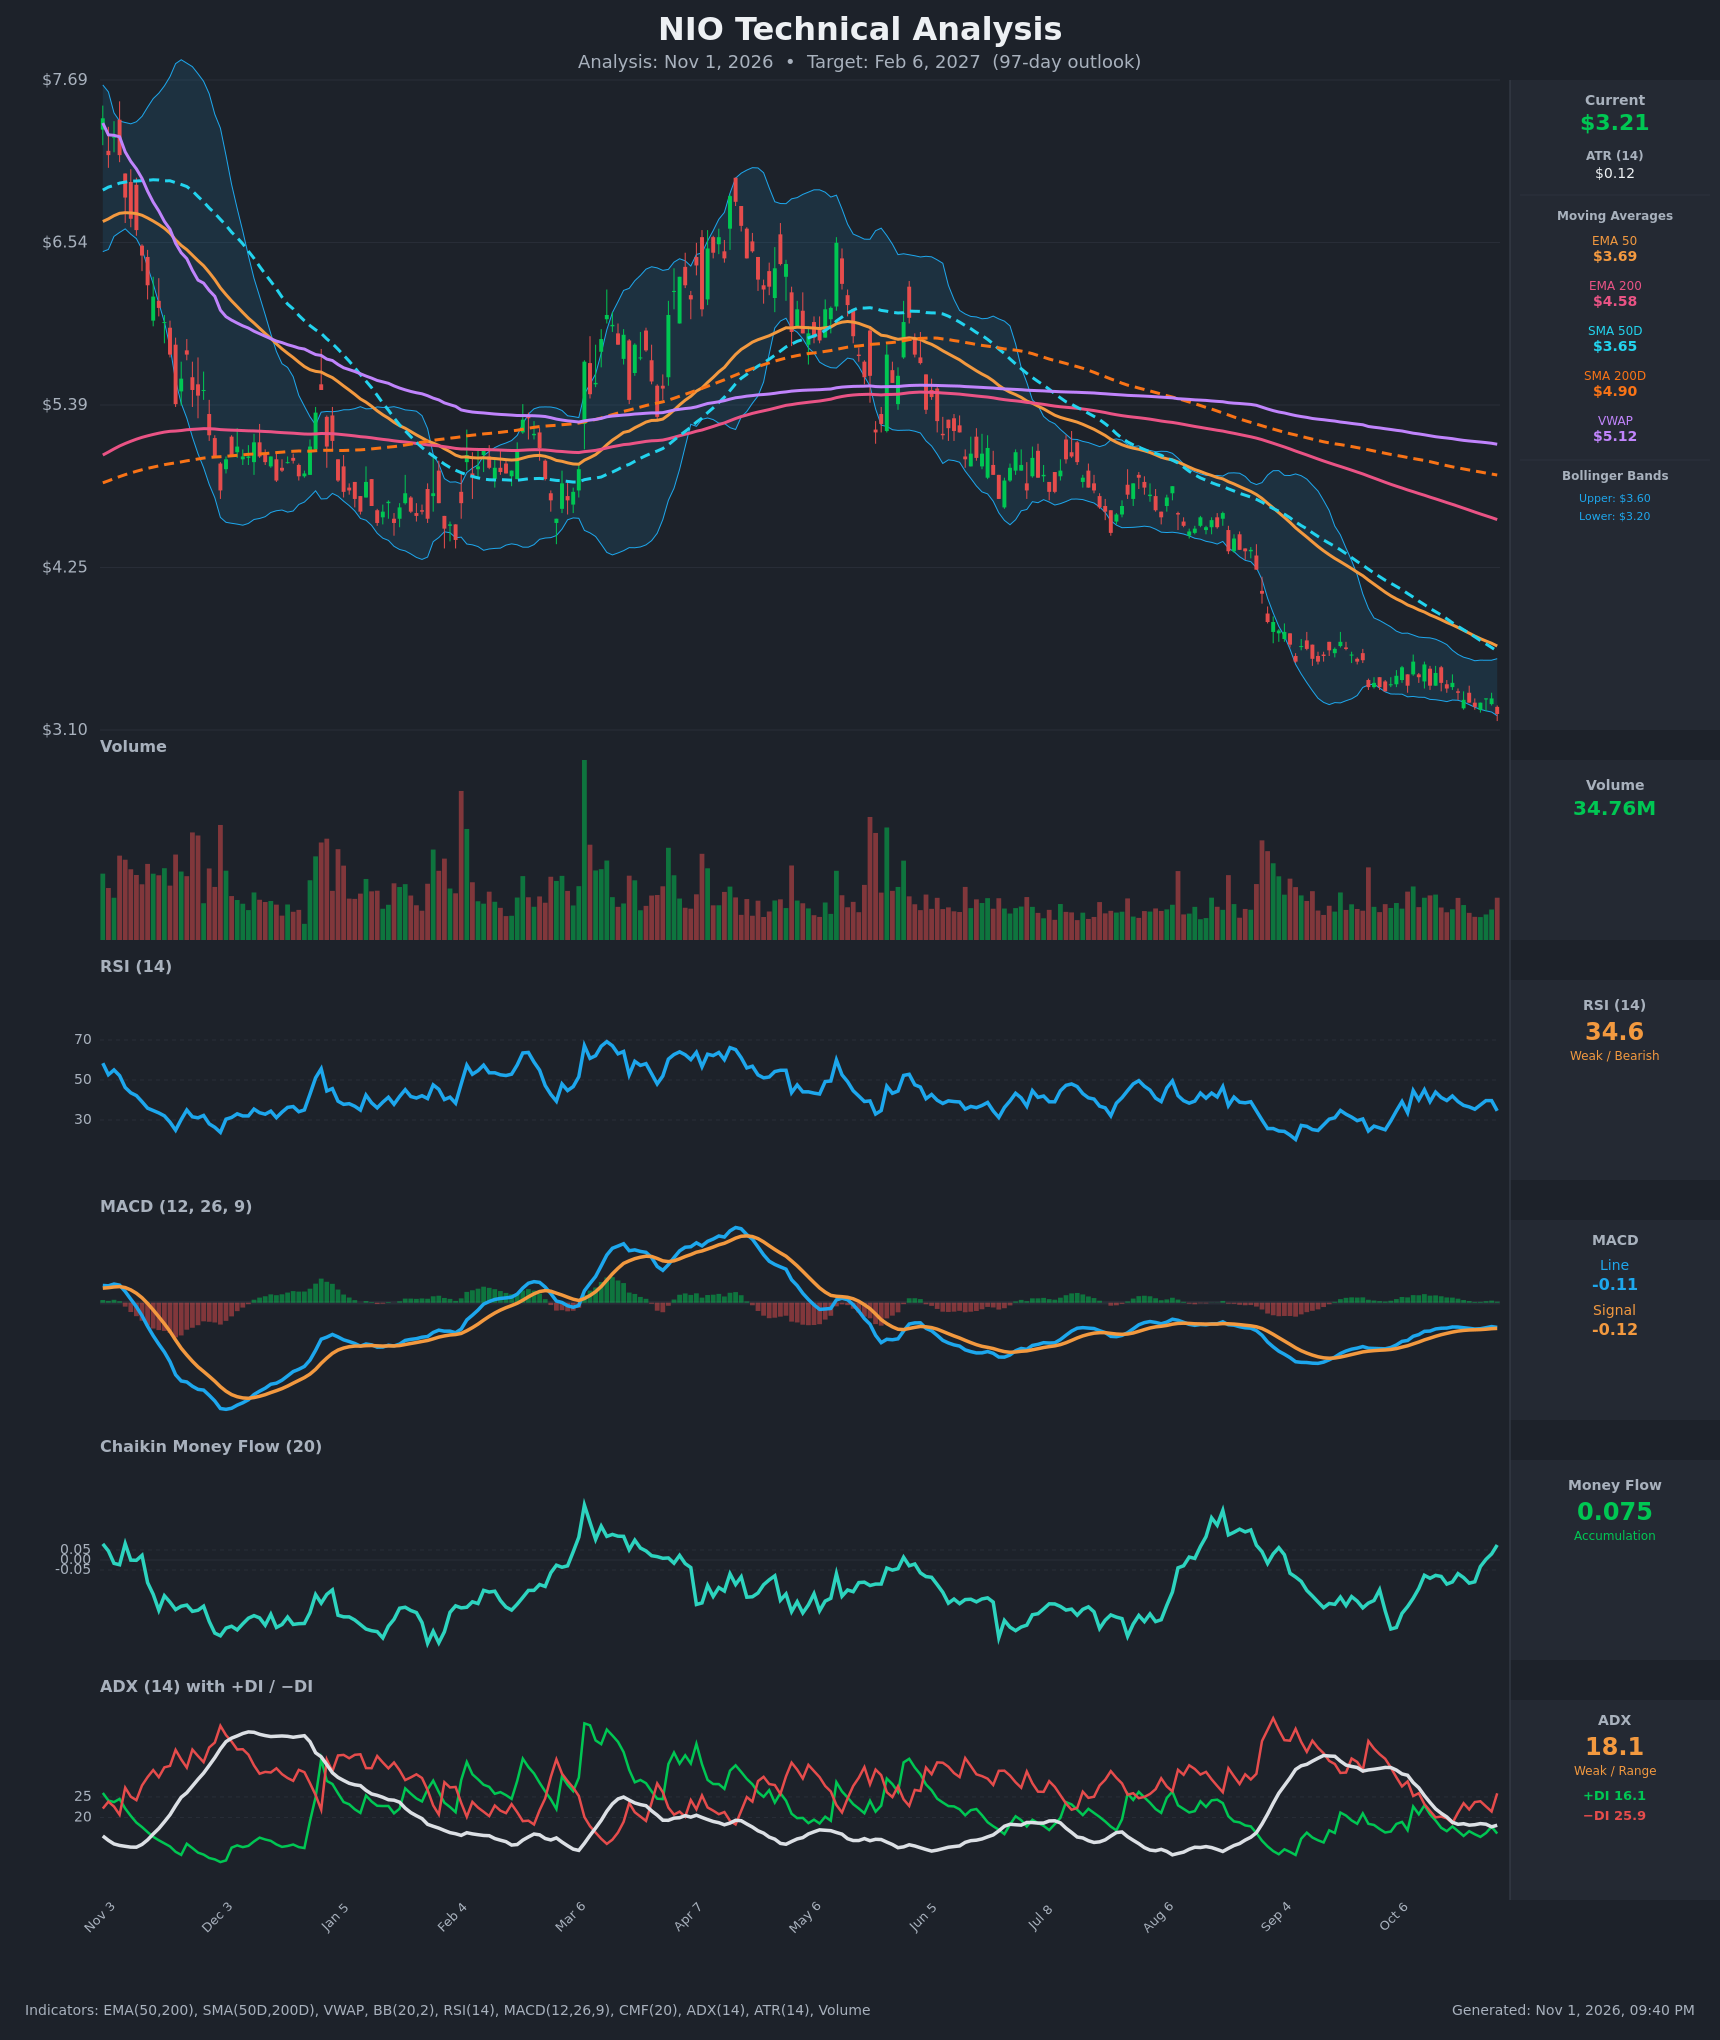
- RSI (14): 34.60, near oversold but not at 30. It fell from 39.7 to 34.6 on the last bar. The September trough was in the mid-20s, so momentum is weak but not extreme. [Bearish]
- 20 EMA: Not supplied. The EMA 50 ($3.69) and SMA 50D ($3.65) are the nearest guides, and price at $3.21 is about 13% below both. They act as overhead resistance, and the EMA 200 ($4.58) and SMA 200D ($4.90) sit far above. [Bearish]
- MACD: Line -0.112 vs signal -0.117, a marginal positive spread of about +0.005. The histogram is near zero. Both lines are below zero and flattening after a mild bullish crossover on about Oct 26–29, but the line has started rolling over again (-0.108 to -0.112). [Neutral]
- Bollinger Bands (20): Upper $3.60, lower $3.197. Price at $3.21 is hugging the lower band, and the bands are narrowing after the September breakdown. That points to a persistent downtrend with a possible compression or bounce. [Bearish]
- CMF (20): 0.075, up from -0.143 on Oct 12 and above the +0.05 threshold. This is a notable improvement that shows buying on down days. It conflicts with the price trend. [Accumulation]
- ADX (14): 18.1 with −DI 25.9 on top of +DI 16.1. The trend is weak, but the directional bias favors sellers, and the DI spread widened on the last bar (−DI jumped from 21.5 to 25.9). [Weak Trend, Bearish Direction]
- Volume: 34.76M. Volume is modest relative to the earlier spikes on the chart, with no capitulation spike. The grind lower is on average volume, so there is neither a washout nor strong conviction. [Neutral-to-Bearish]
DIVERGENCES & TRENDS
- Bullish divergences: Price is at a new low ($3.21) while RSI (34.6) is well above its September low (mid-20s). MACD has made higher lows (-0.145 to -0.112), and CMF has risen from about -0.14 to +0.075. These point to fading selling pressure.
- Trend structure: Price is below the EMA 50, EMA 200, SMA 50D, SMA 200D and VWAP ($5.12). SMA 50D ($3.65) is below SMA 200D ($4.90), and EMA 50 is below EMA 200, so both are in death-cross configuration. Every rally since August has made lower highs, and the moving averages are all sloping down.
- Recent changes: −DI has retaken the lead (25.9 vs 16.1) after a brief +DI/−DI convergence on Oct 29 (17.8 vs 21.5). The MACD crossover was marginal and has not produced any upside follow-through, since price made a new low on Oct 30.
- Overall: The long-term trend is firmly bearish. The indicator divergences suggest the downside is slowing but have not produced a reversal.
CHART PATTERNS
- Bearish Flag / Pennant (continuation): After the sharp September drop from about $4.5 to $3.6, price consolidated in a tight range of about $3.26–$3.56. The break below the range low ($3.26) to $3.21 resembles a bearish flag breakdown. The measured move from the roughly $0.90 pole points to the $2.40–$2.70 area, though this is a theoretical extreme.
- Possible Bullish Falling Wedge (reversal): The lower highs and lower lows are contracting, with the bands narrowing and CMF and MACD improving. This is the main counter-pattern. A close back above about $3.40–$3.60 (the upper band, SMA 50D and EMA 50 area) would be needed to confirm it.
- Verdict: The flag breakdown is the dominant read because the broader structure is a descending channel with lower highs. The wedge reading only gains weight above $3.60.
POTENTIAL SCENARIOS
- Scenario 1: Bearish Trend Continuation — Price breaks the $3.10 chart low and drifts lower in a bearish flag measured-move. −DI stays dominant and rallies fail at the falling EMA 50 and SMA 50D. Trigger: daily close below $3.10 with −DI above 25. Target: $2.90–$3.00, with a stretch toward $2.60. Invalidation: daily close above $3.60 (upper band/SMA 50D). (50% probability)
- Scenario 2: Bullish Base and Mean-Reversion Bounce — Divergences in RSI, MACD and CMF play out and price forms a falling-wedge base, rallying toward the declining moving averages. Trigger: close above $3.40 on rising volume, then a MACD move above zero. Target: $3.60–$3.70 (EMA 50/SMA 50D), possibly $4.00. Invalidation: close below $3.10. (30% probability)
- Scenario 3: Neutral Sideways Basing — Low ADX (18) keeps price oscillating between about $3.00 and $3.50 for the period. Trigger: repeated failures at both $3.10 and $3.50. Target: about $3.20. Invalidation: close outside $2.95–$3.60. (20% probability)
PRICE TARGETS
- Target Price: $3.00 (97-day horizon, about -6.5%)
- Expected Range: $2.60 to $3.40. The width is $0.80, about 25% of the current price, which fits the 61–180 day guidance of 18–30%.
- Key Levels: Support at $3.10 (the chart low and the lower Bollinger Band area), Resistance at $3.60 (upper Bollinger Band, with SMA 50D at $3.65 and EMA 50 at $3.69 just above)
OVERALL BIAS
OVERALL BIAS: BEARISH - Price is below every major moving average, with a death-cross structure, −DI above +DI, and price pinned to the lower Bollinger Band in a flag-breakdown setup. Conviction is modest because the bullish divergences in RSI, MACD and CMF suggest selling pressure is fading, and a bounce toward $3.60 is a real risk.
This is educational analysis and not financial advice.