PFE 97-day bullish forecast — Nov 1, 2026
- Bias: Bullish
- Timeframe: 97 days (made Nov 1, 2026, target date Feb 5, 2027)
- Price at analysis: $30.52
- Price target: $32.20
- Expected range: $28.30 – $35.00
- Result: Pending — graded after the close on Feb 5, 2027
Get a free AI analysis of PFE today
Analysis
TECHNICAL INDICATORS
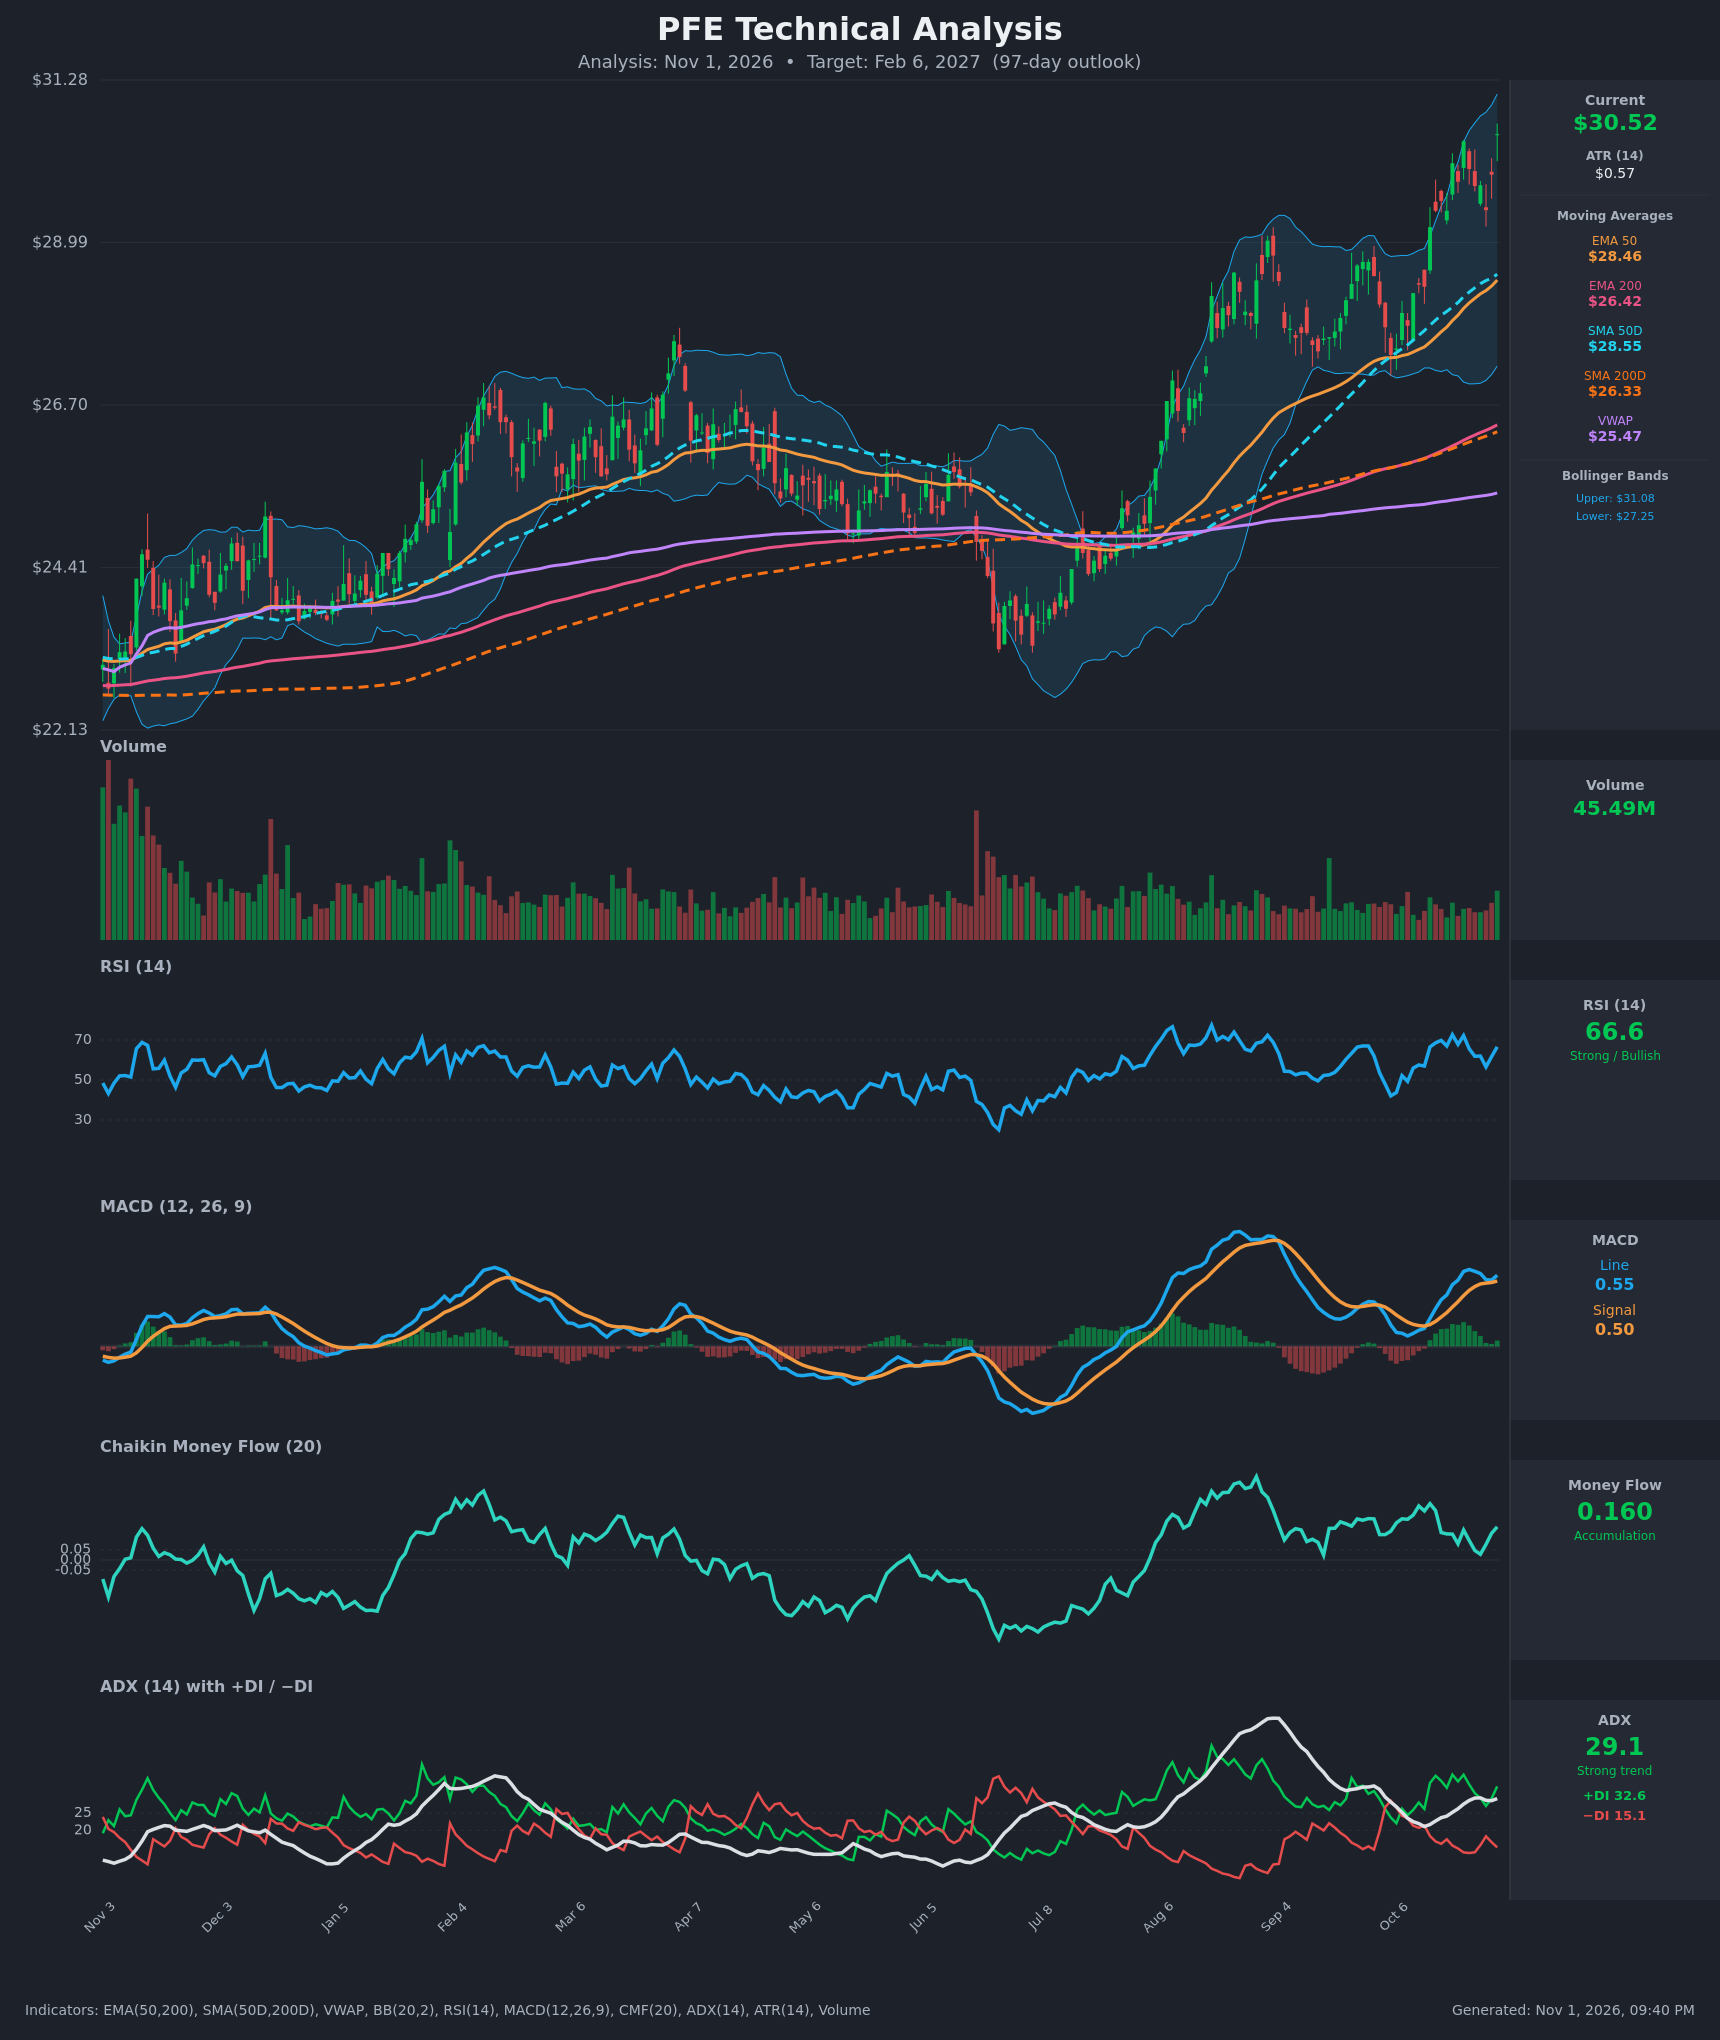
- RSI (14): 66.58, near the overbought line but below 70. It has bounced from 56.5 on Oct 28 and has repeatedly peaked around 70-72 in this leg. Momentum is strong but not yet stretched. [Bullish]
- 20 EMA: The 20 EMA isn't supplied, so I use the 50 EMA ($28.46) as the trend proxy. Price sits about 7% above it and the EMA slopes up, which is dynamic support well below price. The EMA50 ($28.46) is also above the EMA200 ($26.42), and the gap is widening. [Bullish]
- MACD: Line 0.549 is above signal 0.504 with a small positive histogram (+0.045). It re-crossed bullish around Oct 28-30 after the line dipped toward the signal. The cross is fresh but the histogram is thin. [Bullish]
- Bollinger Bands (20): Price is $30.52 against an upper band of $31.08 and a lower band of $27.25, roughly 85% of the way up the band. It has been riding the upper half, which is typical of a trend. Room to the upper band is only about $0.56, one ATR, so near-term upside may be limited without a pause. [Bullish]
- CMF (20): 0.160, firmly above +0.05 and rising off 0.028 on Oct 27. This shows steady accumulation, though it is below the roughly 0.35 peak of August. [Accumulation]
- ADX (14): 29.1 with +DI 32.6 over −DI 15.1. That is a strong trend with bulls clearly in control, and the DI spread is wide. ADX has been flat to slightly rising at 28-29. [Strong Trend + Bullish]
- Volume: 45.49M, around average and not climbing on the latest push to new highs. Up days have somewhat heavier volume than down days, but there is no climactic surge. [Neutral to mildly bullish confirmation]
DIVERGENCES & TRENDS
- Moving averages: SMA50D ($28.55) is well above SMA200D ($26.33). The golden cross is in place and both averages are rising. Price is above SMA200D and above VWAP ($25.47), so the long-term uptrend is intact.
- Possible bearish divergence: Price is at a new high ($30.52, above the August peak). RSI (66.6 vs ~75 in August), MACD (0.55 vs ~1.2) and CMF (0.16 vs ~0.35) are all lower than at the August peak. This points to waning momentum and raises the risk of consolidation or a pullback.
- Trend persistence: The sequence of higher highs and higher lows from July (~$23.2) is intact. Price has doubled back above all key averages, and the Oct 28 dip held well above the EMA50.
- No bearish crossovers: There are no death crosses, and −DI is low and stable. The MACD signal-line re-cross is bullish.
- Extension: Price is about 7% above the EMA50/SMA50D, so it is stretched and mean-reversion risk is elevated.
CHART PATTERNS
- Primary pattern: The pattern closest to the reference diagram is a Bullish Double Bottom / base breakout. The June-July low (~$23.2) was followed by a sharp recovery through the $26-27 resistance and then a continuation advance. This is a bullish reversal that has turned into a sustained uptrend.
- Recent consolidation: Since mid-September, price has formed a choppy, mildly ascending range between about $27.5 and $30.5. This resembles a bullish flag/ascending triangle, and the push to $30.52 is a breakout attempt.
- Targets: A flag measured from the base suggests a measured move toward $32-34. The swing high from ~$27.8 to ~$30.5 projected from $29.5 gives roughly $32.2.
- Caution: The lower momentum highs on a price new high resemble the early stage of a Rising Wedge, so a failure to hold above $29.4 would weaken the bullish read.
POTENTIAL SCENARIOS
- Scenario 1: Bullish Trend Continuation — The ADX trend persists, price holds above the EMA50/SMA50D and grinds higher with pullbacks to the $29.4-$30 zone. Trigger: a daily close above $31.10 (upper BB / chart high) with CMF staying above 0.10. Target: $32.20-$34.00. Invalidation: a daily close below $28.50. (55% probability)
- Scenario 2: Bearish Pullback / Mean Reversion — The bearish momentum divergence plays out and price retraces toward the rising 50-day averages. Trigger: a close below $29.40 with MACD re-crossing below signal. Target: $28.40-$27.30 (EMA50/SMA50D and lower BB). Invalidation: a rebound above $30.60 on rising volume. (30% probability)
- Scenario 3: Neutral Consolidation — Price digests the 90% advance in a $28.80-$31.50 range while the averages catch up. Trigger: ADX rolling over below 25 and flat MACD. Target: $29.50-$31.00. Invalidation: a close outside $28.50-$32.00. (15% probability)
PRICE TARGETS
For the 97-day horizon (Feb 6, 2027), the range width is $35.00 − $28.30 = $6.70, or about 22% of the current price, which is within the 18-30% guidance for 61-180 days.
- Target Price: $32.20
- Expected Range: $28.30 to $35.00
- Key Levels: Support at $28.50 (EMA50/SMA50D zone), Resistance at $31.30 (upper Bollinger Band / chart high)
OVERALL BIAS
OVERALL BIAS: BULLISH - Price sits above all major moving averages with a golden cross in place, a strong ADX (29.1) with +DI far above −DI, accumulation on CMF (0.16) and a fresh bullish MACD cross. The waning momentum versus August and the stretched price argue for pullbacks along the way, but the weight of evidence favors higher prices over 97 days.
This is educational analysis and not financial advice.