SLV 97-day bearish forecast — Nov 1, 2026
- Bias: Bearish
- Timeframe: 97 days (made Nov 1, 2026, target date Feb 5, 2027)
- Price at analysis: $44.60
- Price target: $42.00
- Expected range: $36.00 – $47.50
- Result: Pending — graded after the close on Feb 5, 2027
Get a free AI analysis of SLV today
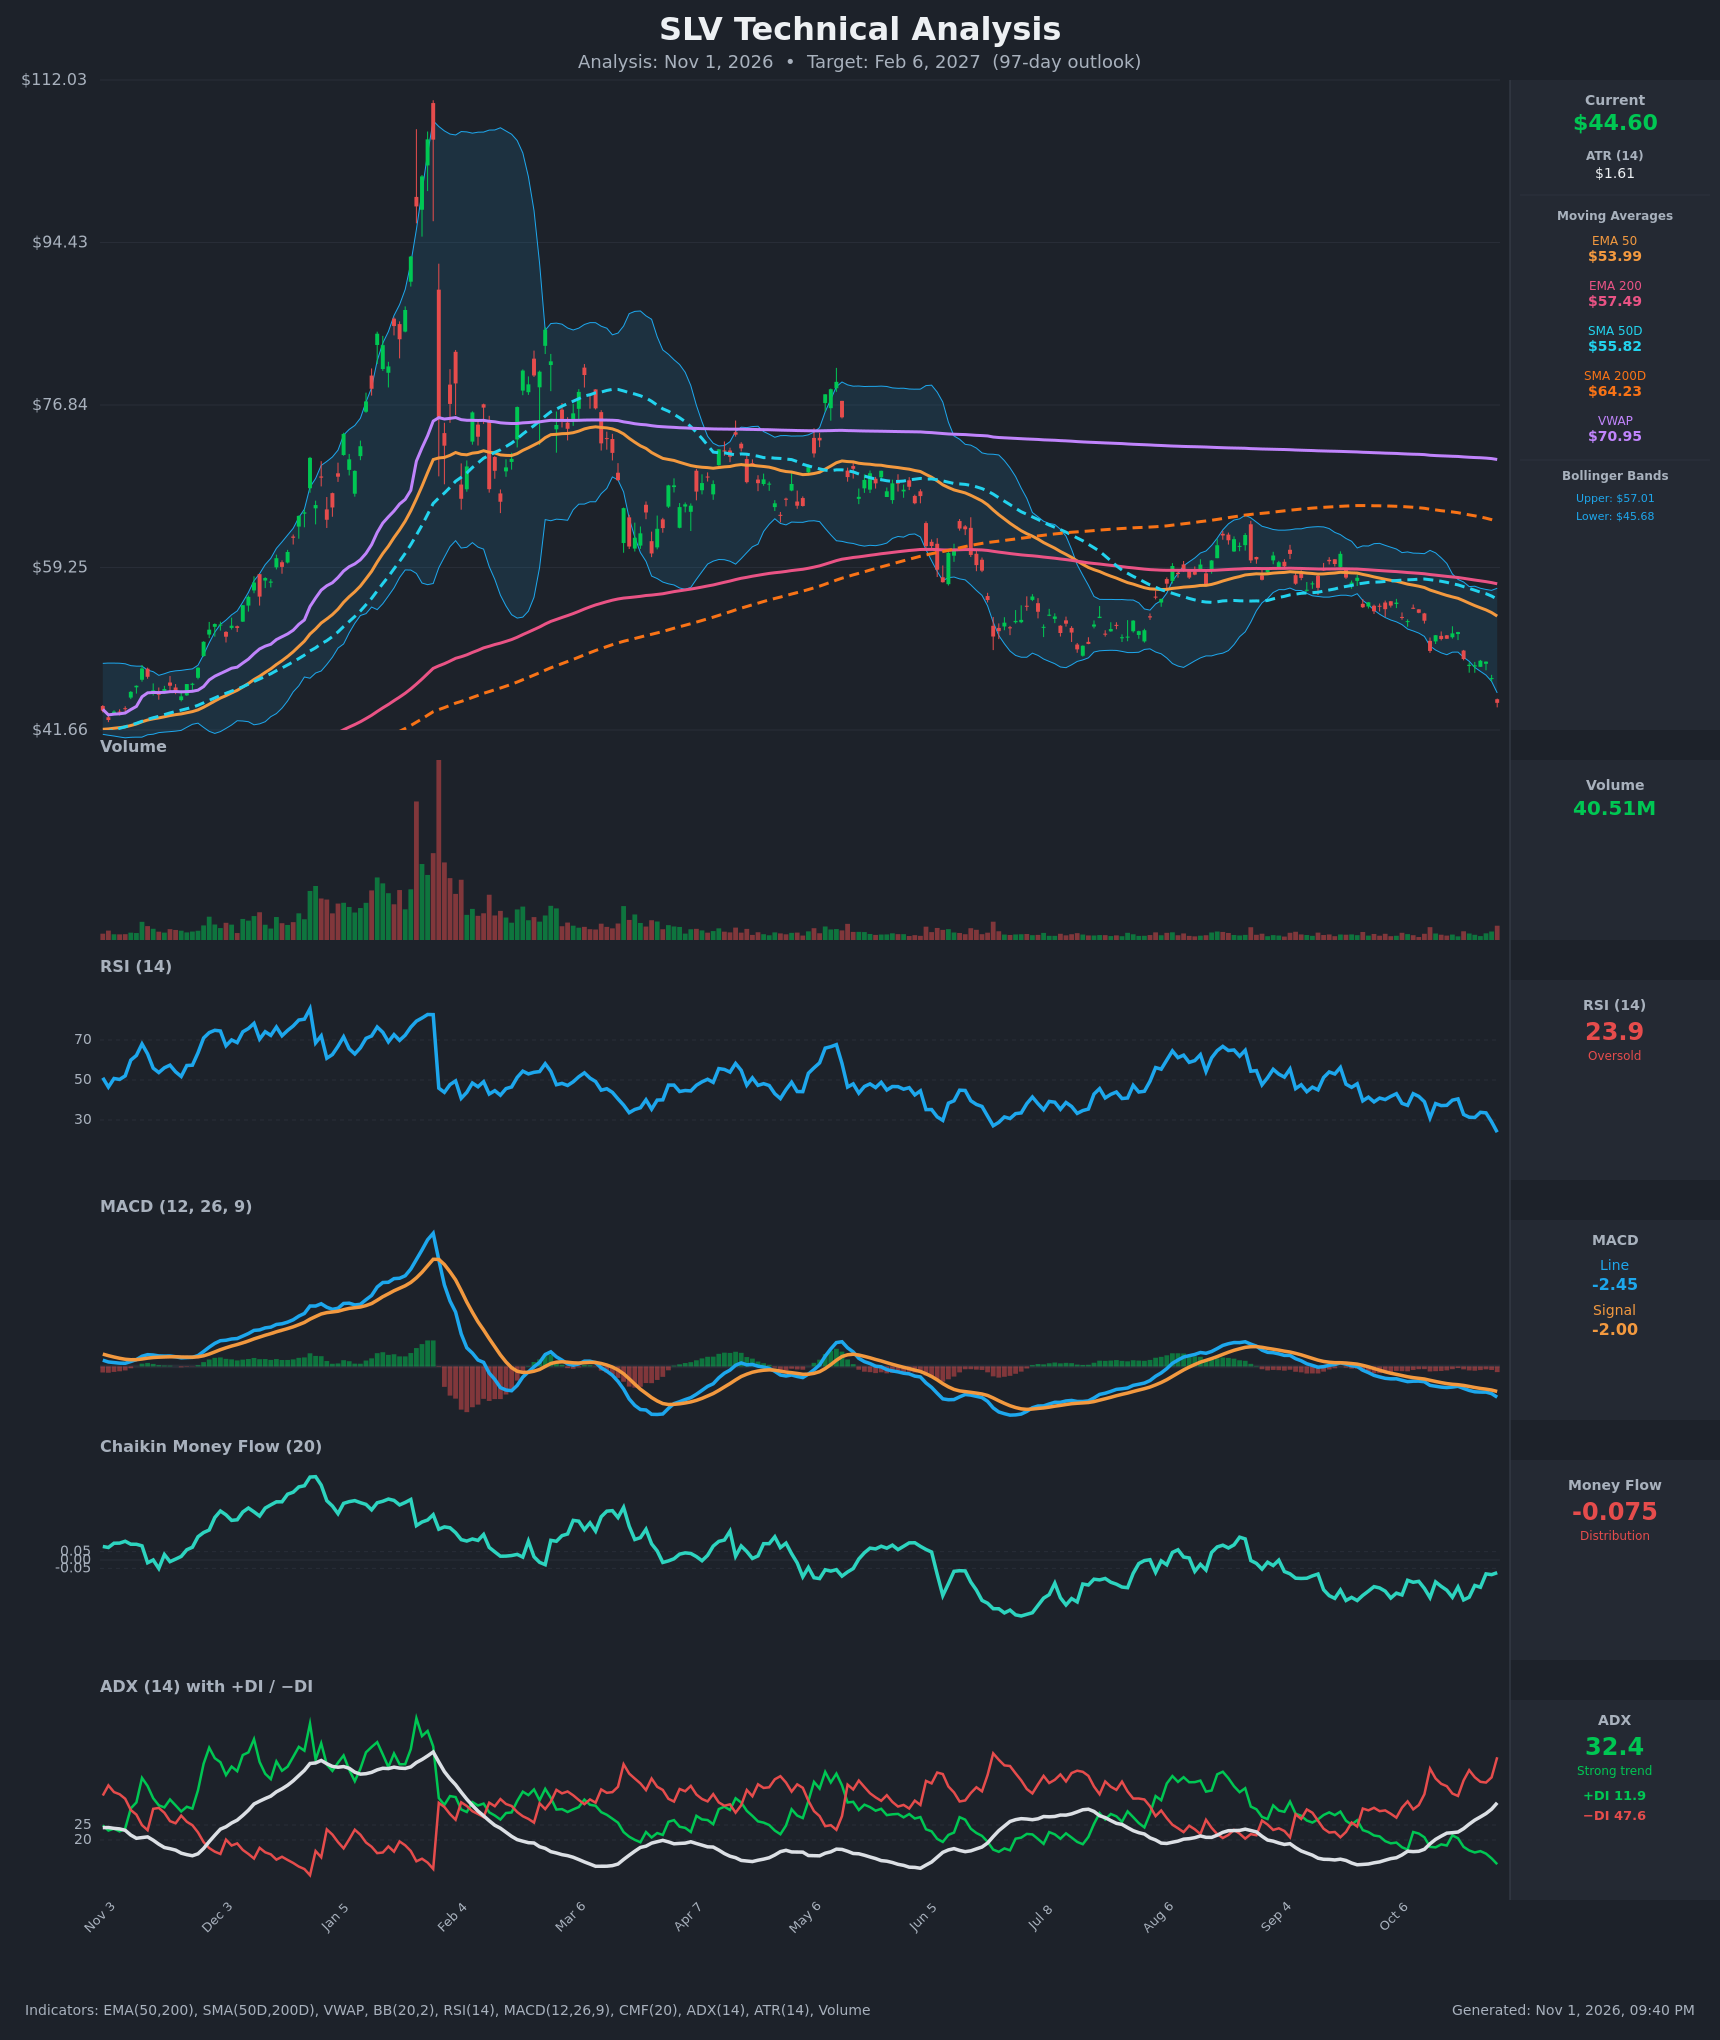
Analysis
TECHNICAL INDICATORS
- RSI (14): 23.9, deeply oversold and at the lowest reading on the chart. It has fallen from 41.8 on Oct 12 to 23.9 with no bullish divergence, so momentum is still pushing lower. Oversold readings in strong downtrends can persist. [Bearish]
- 20 EMA: The 20 EMA is not provided. Price at $44.60 sits well below the EMA 50 ($53.99) and EMA 200 ($57.49), which act as overhead resistance. The 20 EMA is almost certainly above price as well. [Bearish]
- MACD: The line (-2.45) is below the signal (-2.00) and both are below zero. The gap is widening, so the histogram is increasingly negative. The bearish crossover is intact and accelerating. [Bearish]
- Bollinger Bands (20): The bands run from $45.68 to $57.01, and price at $44.60 is below the lower band. This is a stretched condition and a typical trigger for a relief bounce. In a strong trend it also shows a "band walk" with persistent downside pressure. [Bearish]
- CMF (20): -0.075 is below -0.05, which indicates mild distribution. It has been negative for most of the past several months and has not turned positive on any bounce. [Distribution]
- ADX (14): 32.4 and rising from 16 two weeks ago, so a strong trend is developing. −DI (47.6) dominates +DI (11.9) by a wide margin, so sellers are firmly in control. [Strong Trend – Bearish]
- Volume: 40.51M, with a slight uptick on the final bar. Volume is far below the Jan–Feb blow-off levels. The rise on the breakdown to new lows suggests some capitulation but not yet an exhaustion spike. [Mildly Bearish / Possible early capitulation]
DIVERGENCES & TRENDS
- There is no bullish divergence. Price, RSI, MACD and CMF are all making new lows together, which confirms the downtrend rather than warning of a reversal.
- The long-term structure is fully bearish. Price is below the EMA 50, EMA 200, SMA 50D ($55.82), SMA 200D ($64.23) and VWAP ($70.95). The SMA 50D is below the SMA 200D (death cross) and the EMA 50 is below the EMA 200, so both are in bearish alignment.
- ADX is turning up from the mid-teens with −DI surging, which is a classic trend-acceleration signal.
- Price has broken below the Aug–Oct consolidation floor of about $48.7–$49. The Oct 30 close at $44.60 dropped 5.7% in one session, about 1.7 ATR.
- The only counter-signal is the extreme oversold RSI with price below the lower Bollinger Band, which raises the odds of a relief rally within the downtrend.
CHART PATTERNS
- Bearish continuation structure: The decline from the $112 peak has produced a series of lower highs and lower lows. Price formed a rough rectangle/descending range in Jun–Oct and has now broken to the downside. This resembles the "Descending Triangle" and "Bearish Flag" continuation patterns from the reference diagram. The measured move from the range breakdown points to roughly the low $40s.
- Large-scale topping structure: The $112 spike followed by lower highs resembles a completed Bearish Head and Shoulders / blow-off reversal on the higher timeframe.
- Significance: There is no bottoming pattern such as a double bottom or falling-wedge breakout yet. A reversal would need a base to form, then reclaims of $48.7 and $54.
POTENTIAL SCENARIOS
- Scenario 1: Bearish Trend Continuation — Price keeps making lower lows under −DI dominance and a widening MACD gap, with only weak bounces failing at the lower Bollinger Band and the $48–$49 breakdown zone. Trigger: a daily close below $43.50, or failed bounces under $48.66. Target: $41.00–$42.00, with a possible extension to $38. Invalidation: a daily close above $50.20 with RSI back above 45. (50% probability)
- Scenario 2: Bullish Oversold Relief Rally — Extreme oversold RSI and a close below the lower band trigger a mean-reversion bounce toward the broken support zone and the declining EMA 50. Trigger: bullish reversal candle with a volume spike, and RSI turning up through 30. Target: $49–$54 (the EMA 50 area at about $54 is the upper limit). Invalidation: a close below $41.66. (35% probability)
- Scenario 3: Neutral Base-Building Range — After the selloff, price chops between about $41 and $48 as momentum cools, and ADX falls below 25. Trigger: ADX rolling over and CMF moving back above -0.05. Target: $43–$47. Invalidation: a break of either range boundary on volume. (15% probability)
PRICE TARGETS
- Target Price: $42.00 (97 days, Feb 6, 2027)
- Expected Range: $36.00 to $47.50 (width $11.50, about 25.8% of the current price, consistent with the 61–180 day guidance)
- Key Levels: Support at $41.66, Resistance at $45.68
OVERALL BIAS
OVERALL BIAS: BEARISH - Price is below every major moving average with a death cross in place, −DI (47.6) far above +DI (11.9) with ADX rising, MACD and CMF both negative, and no bullish divergence. The extreme oversold RSI argues for a relief bounce, but the trend evidence still outweighs it over a 97-day window.
This is educational analysis and not financial advice.