IREN 19-day bearish forecast — Nov 2, 2026
- Bias: Bearish
- Timeframe: 19 days (made Nov 2, 2026, target date Nov 20, 2026)
- Price at analysis: $23.95
- Price target: $22.40
- Expected range: $21.00 – $24.00
- Result: Pending — graded after the close on Nov 20, 2026
Get a free AI analysis of IREN today
Analysis
TECHNICAL INDICATORS
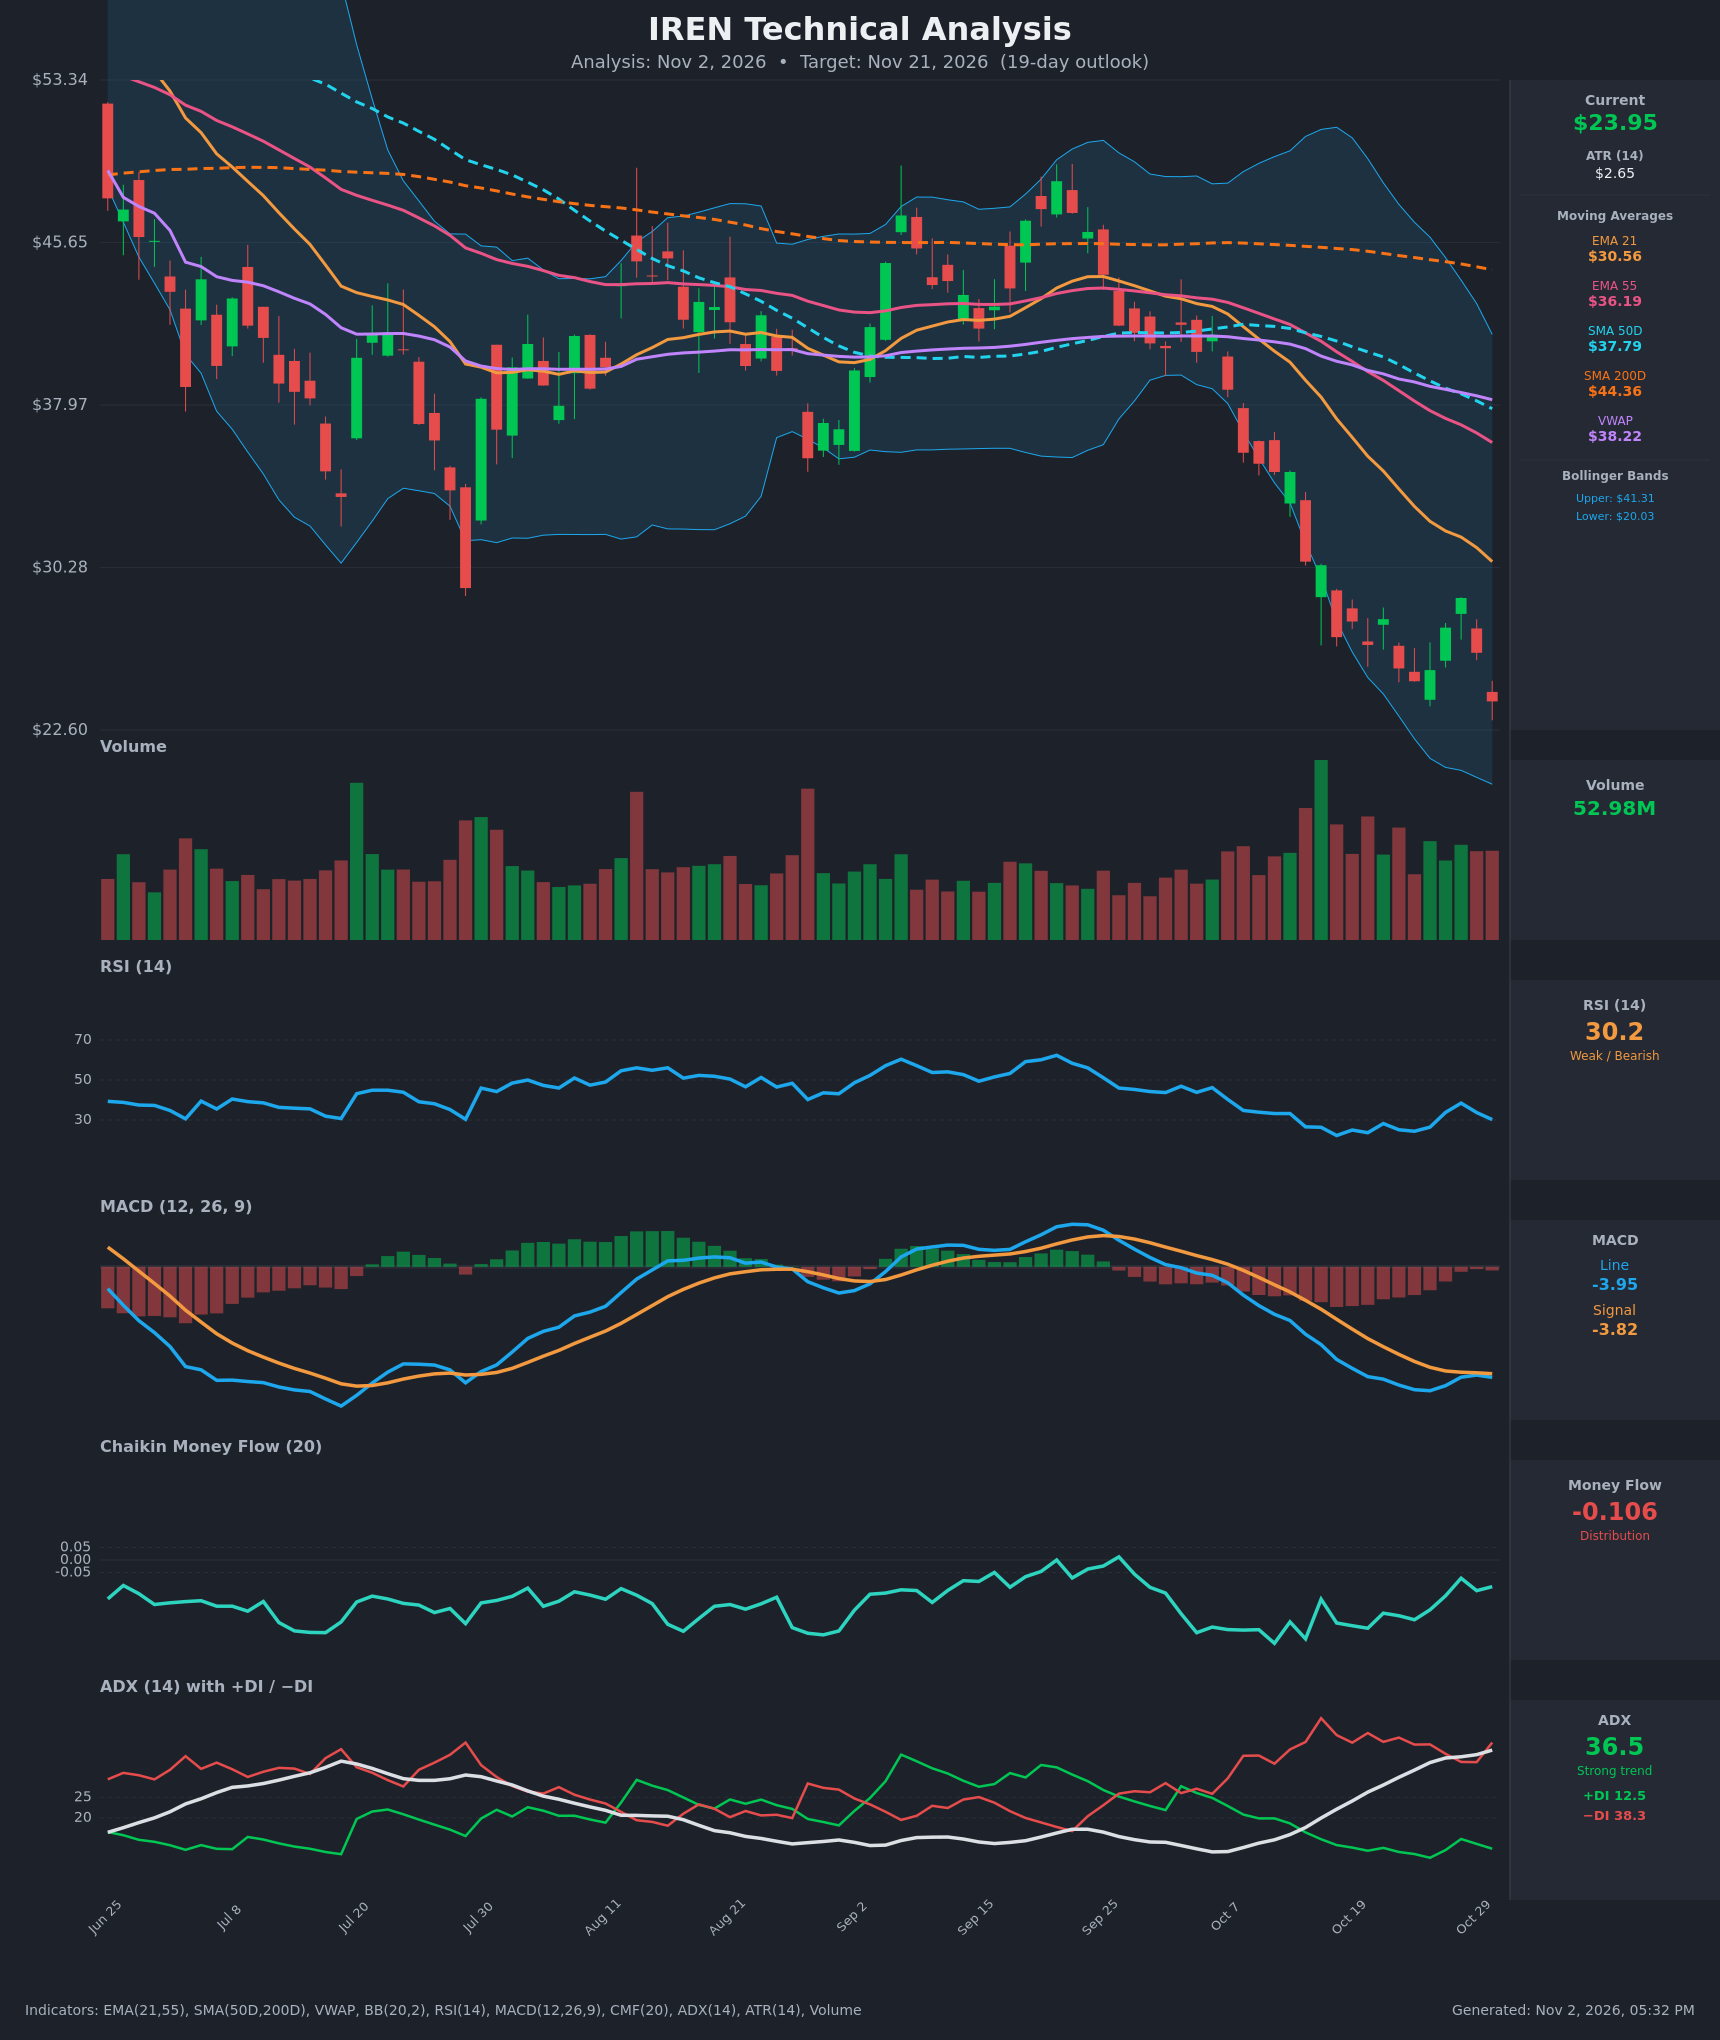
- RSI (14): 30.20, right at the oversold threshold. It fell from 38.4 (Oct 28) to 30.2 in two sessions. The Oct 16–23 lows were 22–25, so RSI is still well above its prior trough even though price has made a new low. [Bearish]
- 20 EMA (EMA 21): $30.56, and price at $23.95 is about 22% below it. The EMA slopes down every session (40.51 to 30.56 over 15 bars) and acts as dynamic resistance. EMA 21 is also below EMA 55 ($36.19), a bearish alignment. [Bearish]
- MACD: Line -3.953 is below signal -3.823, with a small negative histogram of about -0.13. The line is far below zero. The histogram narrowed from about -0.6 to near zero in late October, so downside momentum slowed, but the line has now turned back down. [Bearish]
- Bollinger Bands (20): Upper $41.31, lower $20.03, and the bands are very wide, so volatility is high. Price at $23.95 is in the lower quarter of the band, riding below the midline for weeks. It is not yet at the lower band, so there is about $4 of room to the band. [Bearish]
- CMF (20): -0.106, below -0.05, and negative throughout the 15-bar table (-0.07 to -0.33). That shows sustained distribution, with slight improvement from the -0.33 low. [Distribution]
- ADX (14): 36.5 and rising steadily from 14.7 on Oct 12. −DI is 38.3 and +DI is 12.5, so sellers dominate and the downtrend is strong. [Strong Trend – Bearish]
- Volume: 52.98M, a red candle on above-average volume. Heavy volume in the last several bars shows the selling is active, and the new low was not made on exhaustion-style climactic volume. [Bearish – selling pressure confirmed]
DIVERGENCES & TRENDS
- Possible bullish RSI divergence: Price has just set a new low below the Oct 23 close of $24.91, while RSI at 30.2 is above the 22.2–24.4 trough. This hints at fading downside momentum, but it is not yet confirmed.
- MACD histogram: It narrowed through Oct 28 (the line nearly touched the signal), then rolled over again. The bearish bias holds.
- Moving average structure: The SMA 50D ($37.79) is below the SMA 200D ($44.36), a death cross already in place. Price is far below the SMA 200D, the VWAP ($38.22) and all EMAs, so the long-term trend is down.
- DI/ADX: −DI has been above +DI throughout, and ADX is rising above 25 as the decline matures. A rising ADX with −DI dominant is a classic sign of a persistent downtrend.
- Trend: Price fell from about $42 in early October to $23.95, with a brief relief bounce to $28.84 that failed. That bounce got no closer than about $2 below the EMA 21.
CHART PATTERNS
- Bearish Flag / Pennant (continuation): After the sharp drop from about $41 to $27, price consolidated between roughly $24.9 and $28.8 with lower highs. The close at $23.95 breaks below the pattern, matching the "Bearish Flag/Pennant" breakdown in the diagram. The full measured move is large (pole about $14, implying the low teens). For a 19-day horizon I only expect partial follow-through.
- Descending channel: Price has made consistently lower highs and lower lows since September, which supports a downside bias.
- Reversal caveat: A Bullish Falling Wedge or Double Bottom is possible near $20–22 (lower Bollinger Band, RSI oversold), but neither is confirmed yet.
POTENTIAL SCENARIOS
- Scenario 1: Bearish Flag Breakdown Continuation — The breakdown below the $24.9 consolidation low extends, with sellers in control (−DI 38 vs +DI 12, ADX rising). Price drifts toward the lower Bollinger Band area. Trigger: daily closes below $23.50 on heavy volume. Target: $21.00–$22.50, with a stretch toward $20.03. Invalidation: daily close above $26.30 (back inside the flag). (52% probability)
- Scenario 2: Bullish Oversold Relief Bounce — RSI around 30 with a possible bullish divergence and a narrowing MACD histogram sets up a dead-cat bounce, as seen from Oct 26–28. Trigger: close above $25.50 with RSI rising above 38. Target: $27.50–$28.80 (prior bounce high). Invalidation: close below $22.50. (33% probability)
- Scenario 3: Neutral Basing Near the Lows — Price consolidates between $22 and $25 as selling exhausts. Trigger: several narrow-range days with fading volume. Target: $23–$24.50. Invalidation: a close outside $21.50–$26. (15% probability)
PRICE TARGETS
- Target Price: $22.40 (19-day horizon)
- Expected Range: $21.00 to $24.00 (width $3.00, about 12.5% of the current price, consistent with the 14–21 day guidance)
- Key Levels: Support at $20.03 (lower Bollinger Band), Resistance at $26.30 (flag mid-zone and recent failed-bounce area, with $28.84 above it)
OVERALL BIAS
OVERALL BIAS: BEARISH - Price broke below its recent consolidation with −DI far above +DI, ADX rising at 36.5, MACD below signal, negative CMF, and every moving average stacked above price. Oversold RSI and a possible divergence argue for a bounce risk, but the trend evidence favors further downside.
This is educational analysis and not financial advice.