GLD 7-day bullish forecast — Nov 7, 2026
- Bias: Bullish
- Timeframe: 7 days (made Nov 7, 2026, target date Nov 13, 2026)
- Price at analysis: $372.56
- Price target: $374.50
- Expected range: $363.50 – $381.50
- Result: Incorrect (-4.6%) — closed at $355.55 on Nov 13, 2026; quality score 20/100
Get a free AI analysis of GLD today
Analysis
TECHNICAL INDICATORS
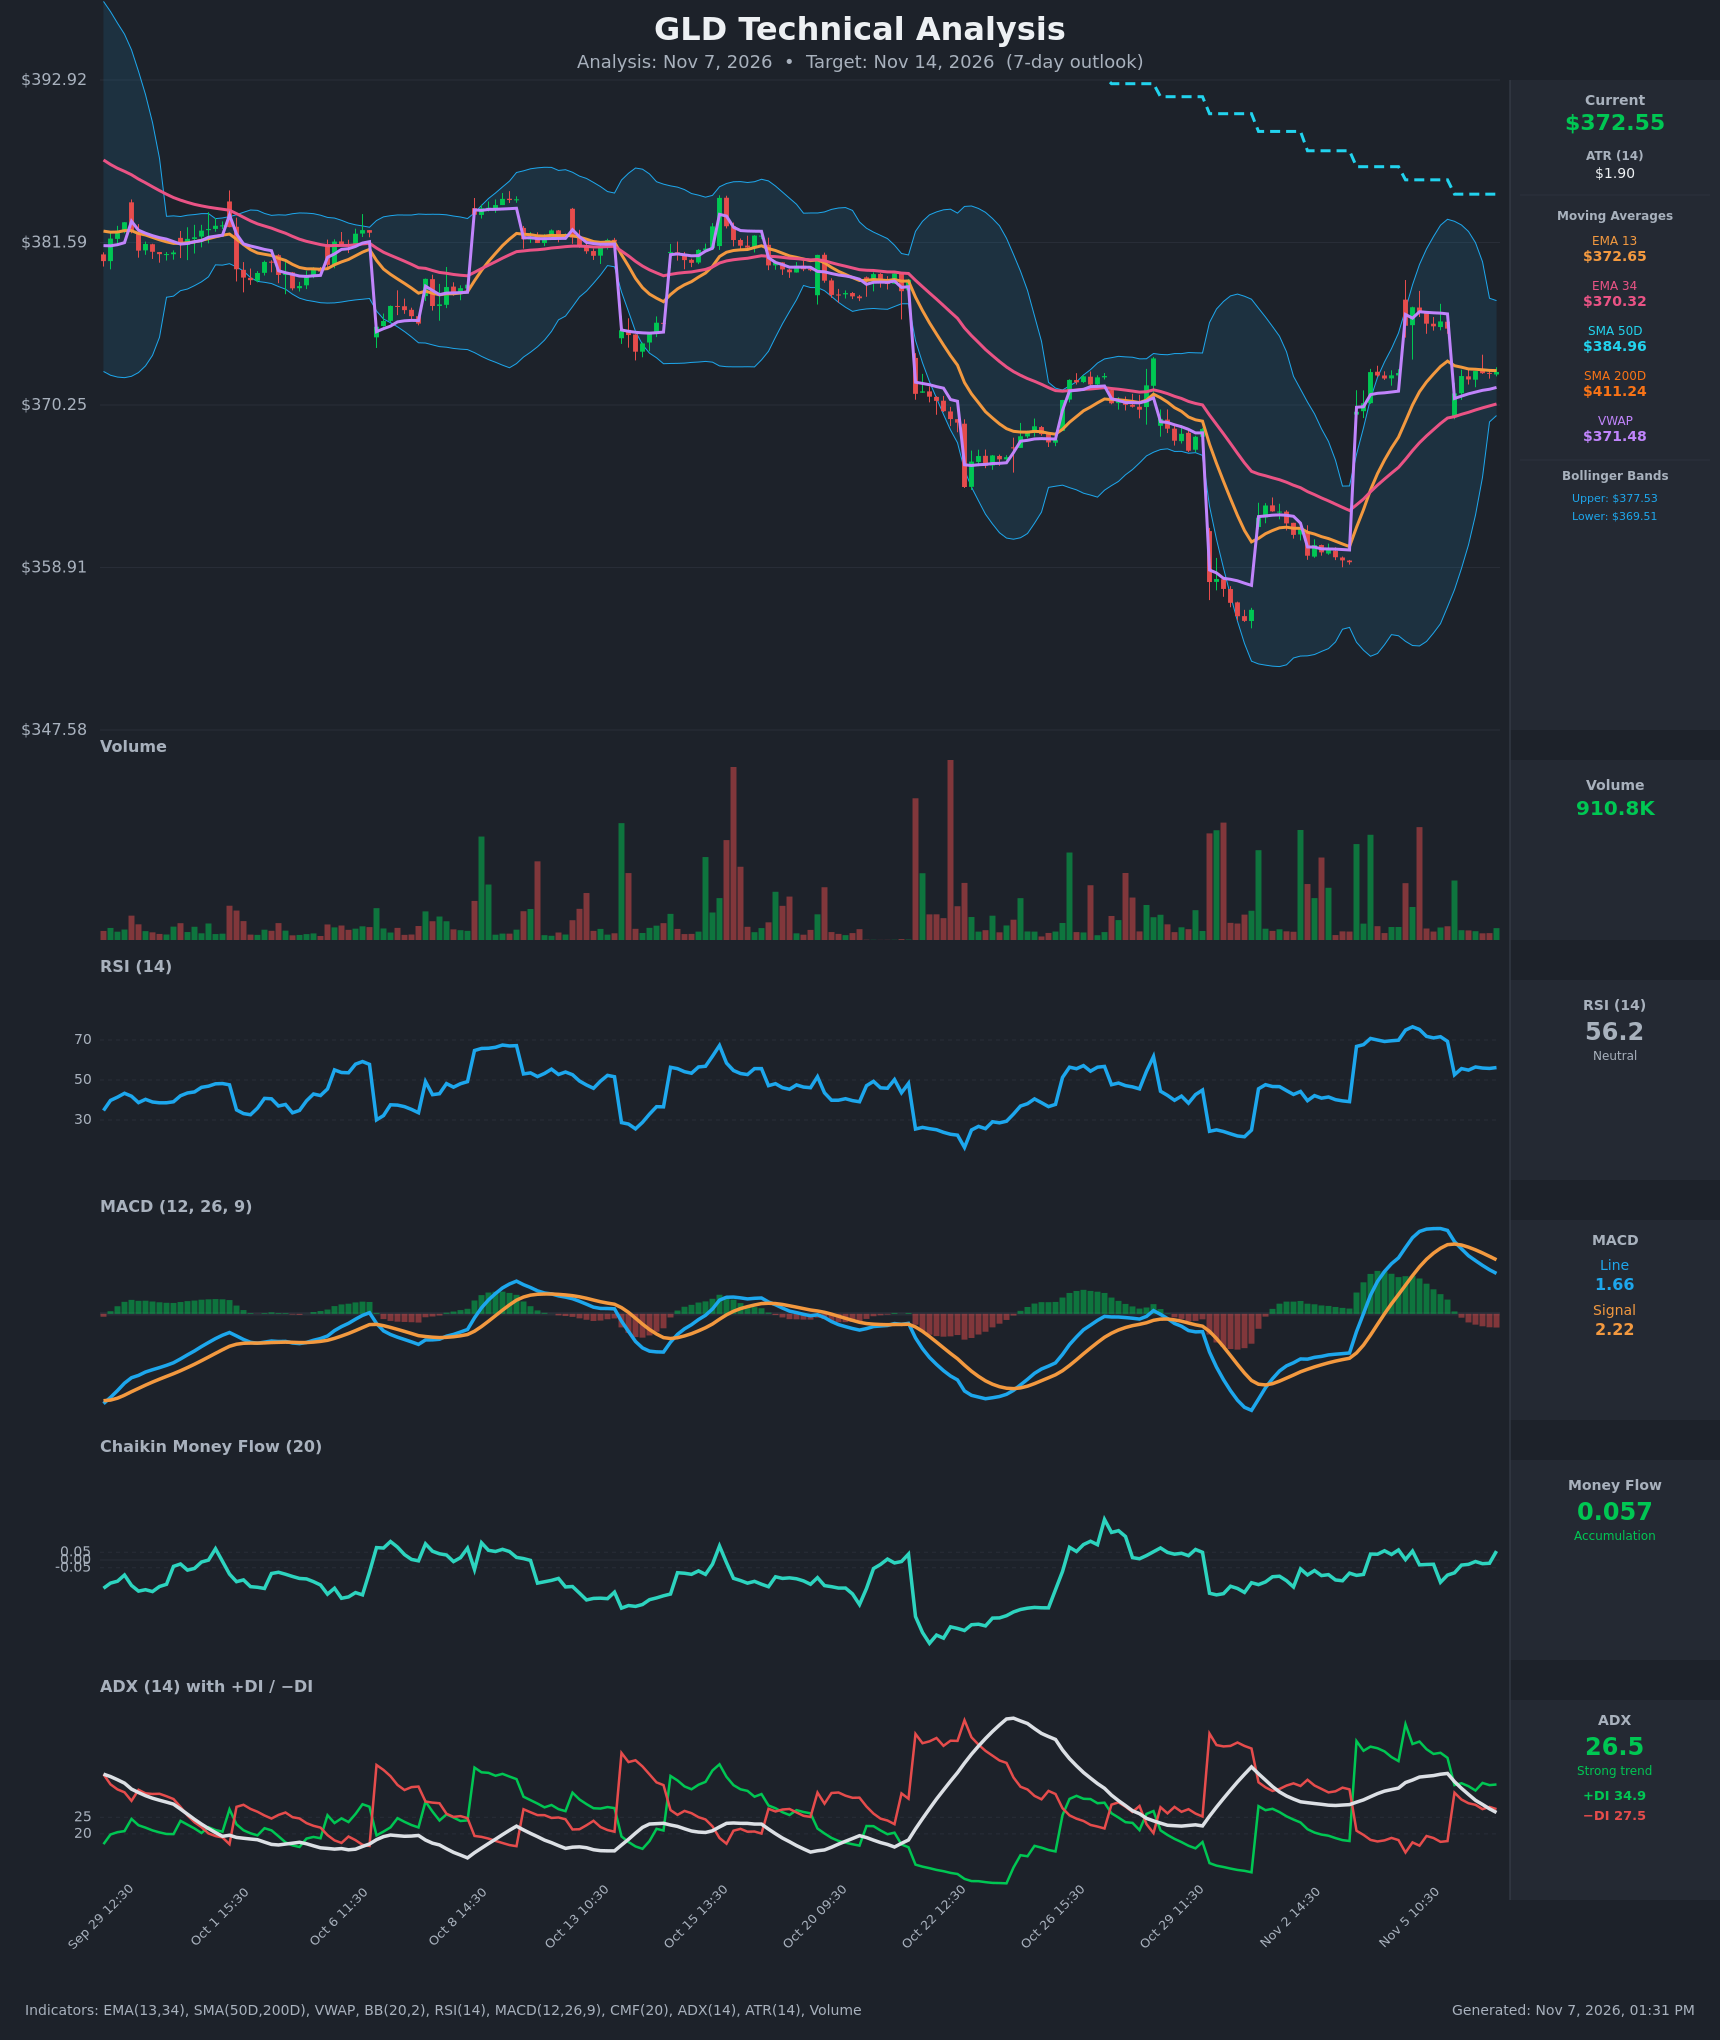
- RSI (14): 56.22, down from an overbought 76.6 on Nov 5 and now sitting just above the 50 midline. Momentum has cooled but not broken. [Neutral]
- 20 EMA: The data gives EMA13 at $372.65 and EMA34 at $370.32. Price ($372.55) is pinned right on EMA13, which is flat. EMA13 is still above EMA34, so the short-term structure is intact and EMA34 is the next support. [Neutral]
- MACD: Line 1.66 is below signal 2.22, with a histogram of about -0.56. The bearish crossover happened around Nov 6 09:30 and the gap has widened since, though from a high base, so this is a pullback in momentum rather than a trend reversal. [Bearish]
- Bollinger Bands (20): Upper $377.53, lower $369.51, midline about $373.5. Price is just below the midline and the bands are narrowing after the big expansion on the sell-off and rebound. The market is in a post-rally digestion phase. [Neutral]
- CMF (20): 0.057 just crossed above the +0.05 threshold after hovering slightly negative (-0.03 to -0.14) for most of the pullback. This is marginal accumulation and a tentative improvement. [Accumulation]
- ADX (14): 26.5, falling from 38.3, with +DI 34.9 above −DI 27.5. Bulls still lead, but the DI spread has narrowed sharply from 43/18, so the trend is fading. [Strong but weakening Trend, bullish lean]
- Volume: 910.8K, with no spike on the pullback. The Nov 6 gap-down came on modest volume, and the heavy volume bars came on the earlier sell-off and the rebound. Light-volume consolidation after a rally is typically benign. [Neutral to mildly bullish]
DIVERGENCES & TRENDS
- No clear divergence. RSI and price both peaked around Nov 5 and have cooled together.
- The MACD bearish crossover came with price only drifting sideways. That points to momentum cooling rather than aggressive selling.
- Price is above VWAP ($371.48) and EMA13 is above EMA34. Both are short-term bullish.
- Price is well below SMA50 ($384.96) and SMA200 ($411.24). The larger trend is down, and the SMA50 slope is still falling, so any bounce faces heavy overhead supply. SMA50 is below SMA200, a death-cross configuration, and neither SMA is a near-term target.
- The DI spread and ADX are both compressing, so trend energy is draining and a range is forming.
CHART PATTERNS
- Bullish Flag / Pennant (continuation): After the sharp rally from about $358 to $377, price has pulled back into a tight $371–$373 band on light volume. This is the closest match in the reference diagram. A breakout above about $374–$377 would measure to roughly $385 (the flagpole is about $19), though SMA50 near $385 would cap it.
- V-shaped recovery inside a larger downtrend: The flag is forming under falling SMA50/SMA200, which lowers the odds of a full measured move. Expect resistance around $377.5, the upper Bollinger Band and the recent high.
- Bearish risk: A close below $369.5 would invalidate the flag. That would suggest a lower-high rejection and a retest of the $358–$362 area.
POTENTIAL SCENARIOS
- Scenario 1: Bullish Flag Breakout — Price holds the EMA34/VWAP zone, consolidates, and breaks out as CMF stays positive and +DI remains dominant. Trigger: close above $374.50 on rising volume. Target: $377.50, then $380. Invalidation: close below $369.50. (45% probability)
- Scenario 2: Bearish MACD Rollover — The bearish MACD cross and fading ADX lead to a breakdown, and the rally is sold as a lower high under the falling SMA50. Trigger: close below $370.30 (EMA34), then $369.50. Target: $365, then $361. Invalidation: reclaim of $375 with MACD turning up. (35% probability)
- Scenario 3: Neutral Chop — Price oscillates between $369.5 and $377.5 as ADX decays below 25. Trigger: ADX below 20 and repeated EMA13 whipsaws. Target: $371–$375. Invalidation: close outside the $369.5–$377.5 band. (20% probability)
PRICE TARGETS
Range check: $381.50 − $363.50 = $18.00, which is 4.8% of the current price. This fits the 4–8% guidance for a 7-day timeframe.
- Target Price: $374.50 (7-day)
- Expected Range: $363.50 to $381.50
- Key Levels: Support at $369.50, Resistance at $377.50
OVERALL BIAS
OVERALL BIAS: BULLISH - Price is holding above VWAP and EMA34 in a tight, low-volume flag after a sharp rally. CMF has turned positive and +DI still leads −DI. The conviction is modest because MACD has crossed bearish, ADX is fading, and price sits far below the SMA50 and SMA200, which cap upside.
This is educational analysis and not financial advice.