GLD 4-day bearish forecast — Nov 7, 2026
- Bias: Bearish
- Timeframe: 4 days (made Nov 7, 2026, target date Nov 10, 2026)
- Price at analysis: $372.56
- Price target: $370.80
- Expected range: $365.50 – $379.00
- Result: Correct (-0.7%) — closed at $369.97 on Nov 10, 2026; quality score 100/100
Get a free AI analysis of GLD today
Analysis
TECHNICAL INDICATORS
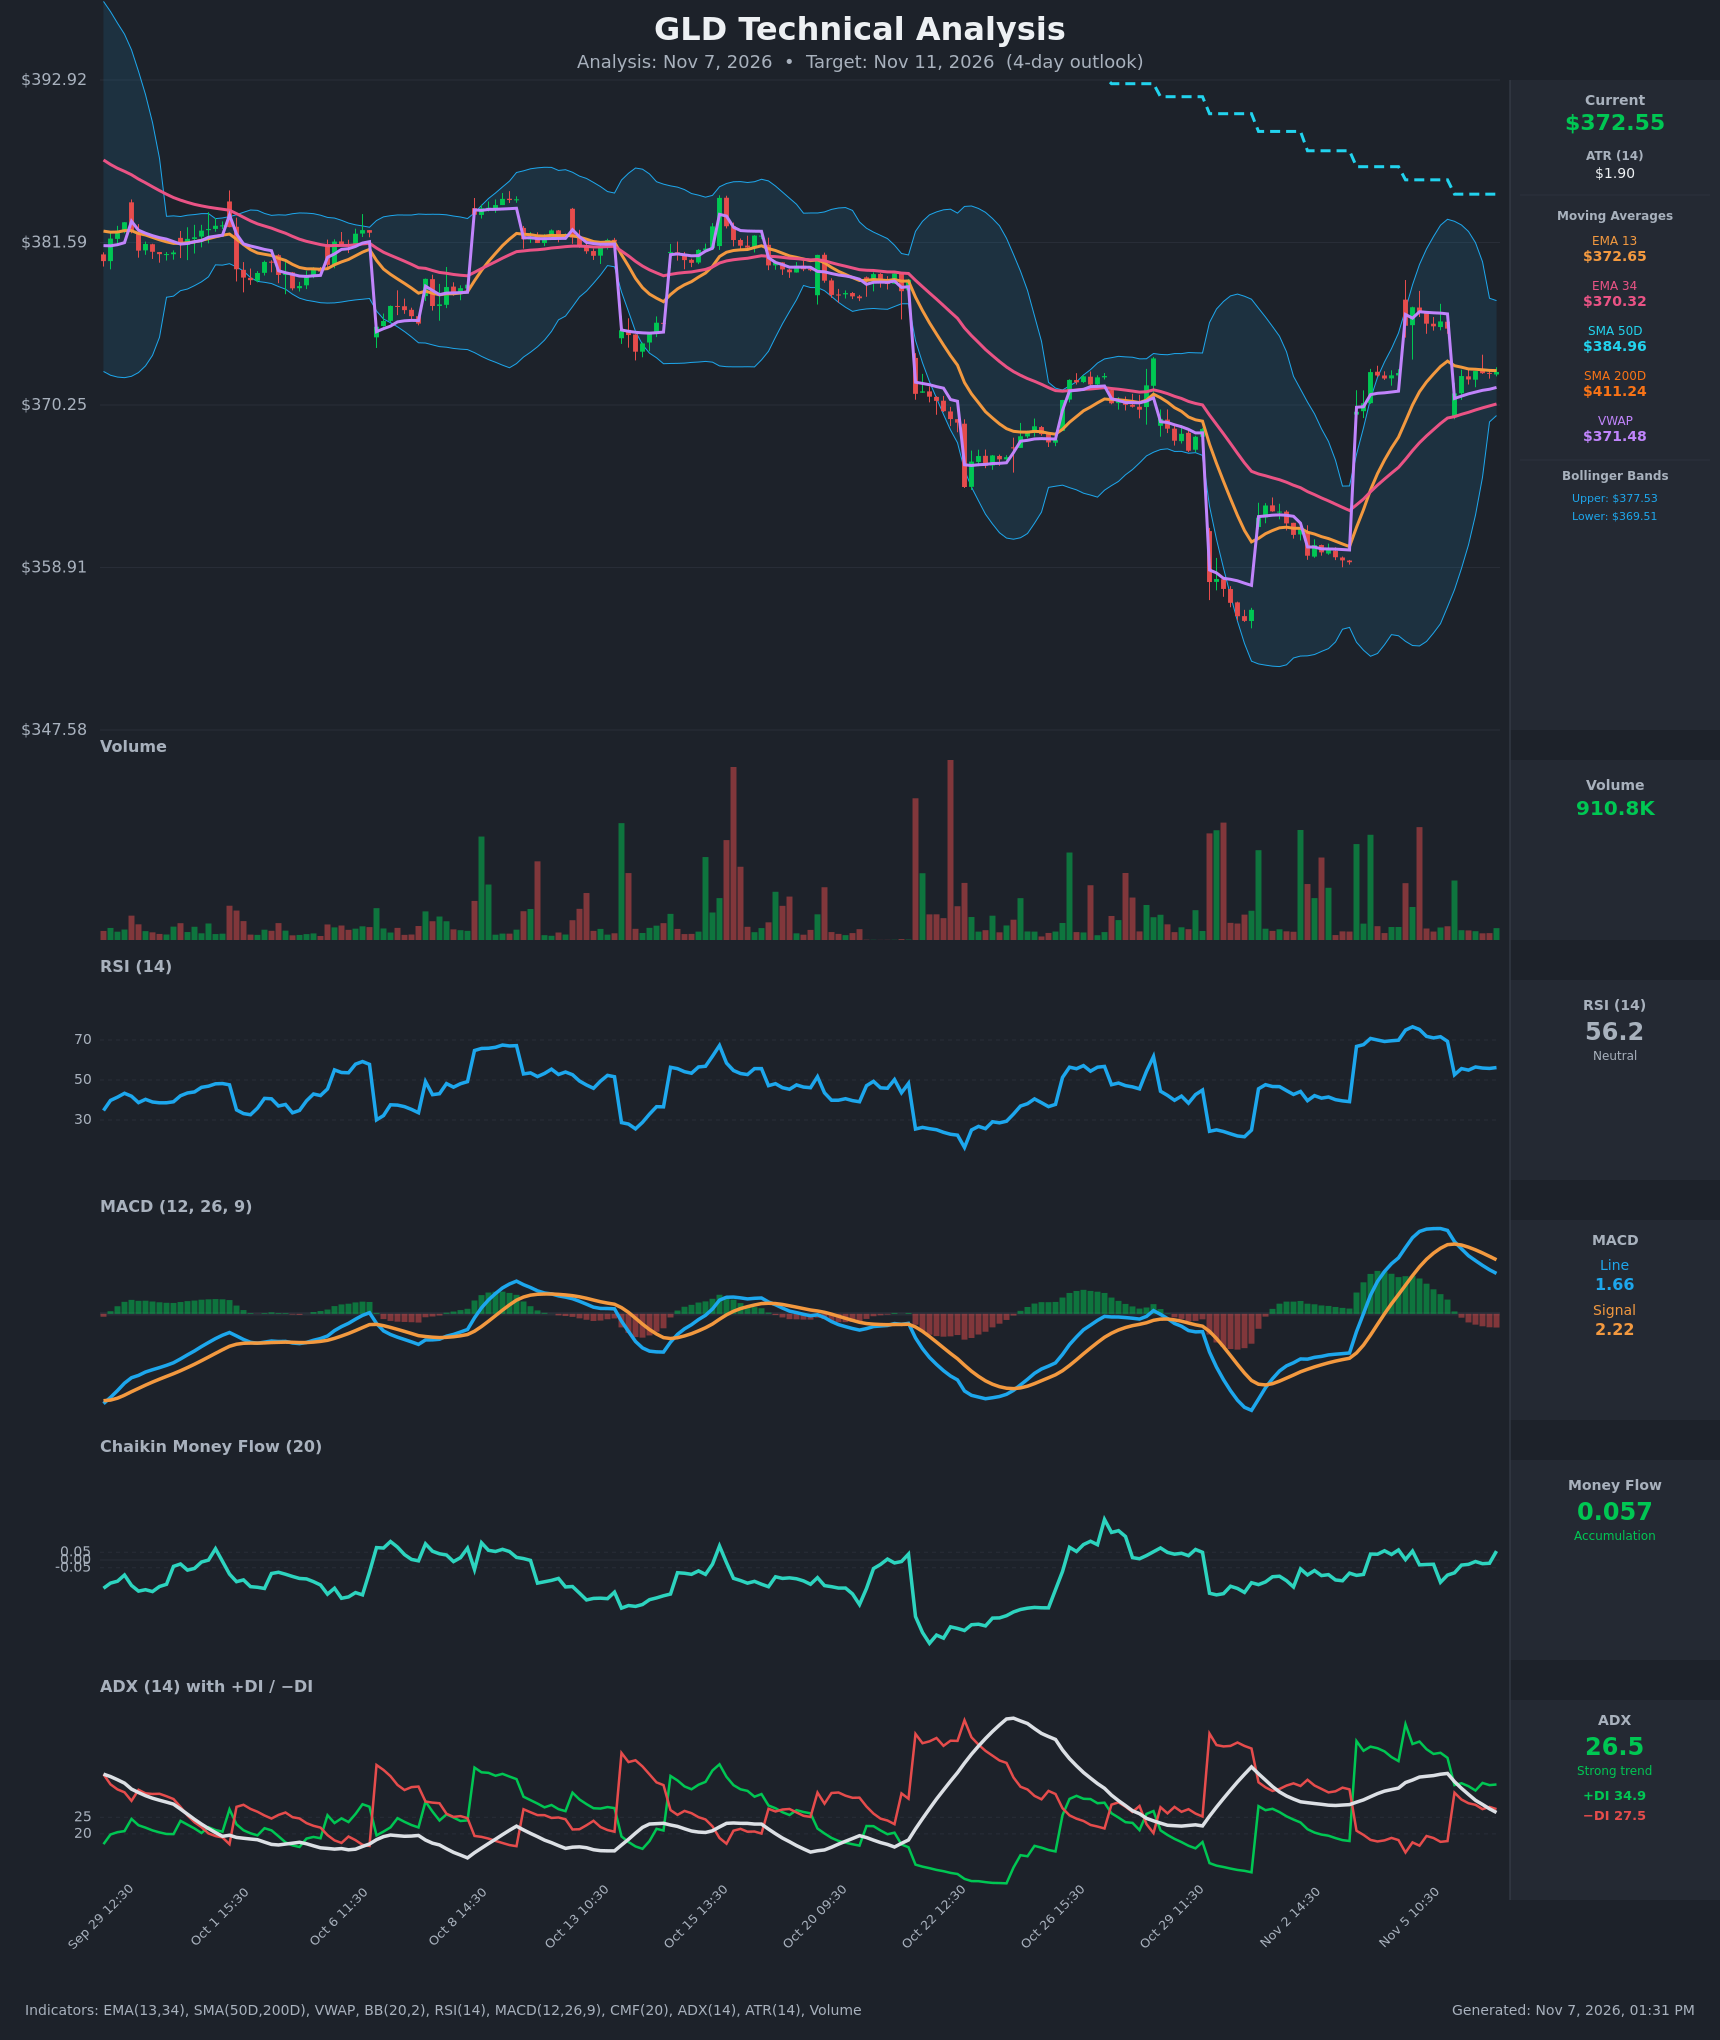
- RSI (14): 56.2, down sharply from the 75-77 overbought peak on Nov 5. It has settled in a neutral 52-57 band since Nov 6, so the overbought momentum burst has been fully reset and is not yet rebuilding. [Neutral]
- 20 EMA: The supplied EMAs are 13/34. EMA13 is $372.65 and price ($372.56) sits right on it, a tiny hair below. EMA34 at $370.32 is rising and sits about $2.2 below price as dynamic support. EMA13 is still above EMA34, so the short-term structure is intact but flattening. [Neutral]
- MACD: Line 1.66 is below signal 2.22, and the histogram is negative and widening. The bearish crossover happened on Nov 6 09:30 and the line has fallen every bar since, heading toward the zero line. [Bearish]
- Bollinger Bands (20): Upper $377.53, lower $369.51, midline about $373.5. Price sits just under the midline. The bands are wide after the volatile rally and are starting to contract, which points to consolidation. The lower band doubles as near-term support. [Neutral]
- CMF (20): 0.057 is just above the +0.05 threshold. It had been slightly negative through most of Nov 5-6 and only ticked up on the last bar, so the accumulation signal is marginal. [Accumulation]
- ADX (14): 26.5 and falling from 38. +DI (34.9) is above −DI (27.5), so bulls retain control, but the gap has narrowed sharply from 42 vs 18. The trend is still technically strong but fading fast. [Strong but weakening trend, bullish bias]
- Volume: 910.8K, subdued compared with the heavy bars during the Nov 5 rally and the earlier selloff. The drift lower on Nov 6 came on light volume, so there is no strong conviction either way. [Neutral / consolidation]
Other levels:
- Price is above VWAP ($371.48), a mild positive.
- Price is well below SMA50 ($384.96) and SMA200 ($411.24). The long-term trend is down, and the SMA50 is below the SMA200 (death cross state).
DIVERGENCES & TRENDS
- MACD made a bearish crossover and its histogram is deepening, while price has held flat at $372. This is early momentum erosion rather than a classic divergence.
- RSI fell from 76 to 56 while price only retraced from $377 to $372. The reset happened mostly through a quick Nov 6 gap/drop.
- ADX is falling and DI spread is compressing, so trend strength from the rally is dissipating.
- Price has been compressing around the 13 EMA/VWAP for the last 7 bars with very tight closes ($372.0-$372.6).
- The long-term trend is still bearish, with the SMA50 and SMA200 both overhead and sloping down.
CHART PATTERNS
- Bullish Flag / Pennant (continuation): The sharp rally from about $358 to $377 forms a flagpole, followed by tight sideways-to-lower consolidation. A breakout above about $374-375 would target roughly $390+ (the flagpole measured from the breakout), though the SMA50 at $385 is heavy overhead resistance.
- Failed bounce risk: The rally stalled at $377 under the SMA50 and has not retaken it. If the consolidation breaks down through EMA34/VWAP at about $370-371, the bounce looks like a rally within a larger downtrend, and the next support is the Bollinger lower band at $369.5, then the $358-360 pivot zone.
- The flag is shallow and orderly, but weakening MACD and ADX argue against a strong immediate breakout over a 4-day window.
POTENTIAL SCENARIOS
- Scenario 1: Bearish Drift to EMA34/VWAP — Momentum continues to fade (MACD heading to zero, ADX falling) and price loses EMA13, then slides into the $370-371 confluence of EMA34, VWAP and the lower Bollinger Band. Trigger: Hourly close below $371.50. Target: $370.50, with a stretch to $368.50. Invalidation: Close above $375.50. (42% probability)
- Scenario 2: Bullish Flag Breakout — Buyers defend the EMA34/VWAP area, CMF stays positive and price breaks the consolidation to retest the $377 high. Trigger: Hourly close above $374.50 on rising volume. Target: $377.50. Invalidation: Close below $370.00. (35% probability)
- Scenario 3: Neutral Range Chop — Price stays pinned at $370.5-$374.5 around the 13 EMA with low volume. Trigger: No close beyond $370.5 or $374.5. Target: $372.50. Invalidation: Decisive close outside the range. (23% probability)
PRICE TARGETS
- Target Price: $370.80 (4-day)
- Expected Range: $365.50 to $379.00 (width $13.50, about 3.6% of current price, which fits a 4-day horizon)
- Key Levels: Support at $370.32 (EMA34), with the lower Bollinger Band at $369.51 below it. Resistance at $377.53 (upper Bollinger Band / recent high area).
OVERALL BIAS
OVERALL BIAS: BEARISH - The MACD bearish crossover with a widening negative histogram, falling ADX, and price stuck below the declining SMA50/SMA200 favor a mild pullback toward the EMA34/VWAP zone near $370.5. The conviction is modest because the bullish-flag structure and positive +DI/CMF keep a breakout alive.
This is educational analysis and not financial advice.