QUBT 7-day bullish forecast — Nov 7, 2026
- Bias: Bullish
- Timeframe: 7 days (made Nov 7, 2026, target date Nov 13, 2026)
- Price at analysis: $6.33
- Price target: $6.58
- Expected range: $6.10 – $6.95
- Result: Incorrect (-13.9%) — closed at $5.45 on Nov 13, 2026; quality score 0/100
Get a free AI analysis of QUBT today
Analysis
TECHNICAL INDICATORS
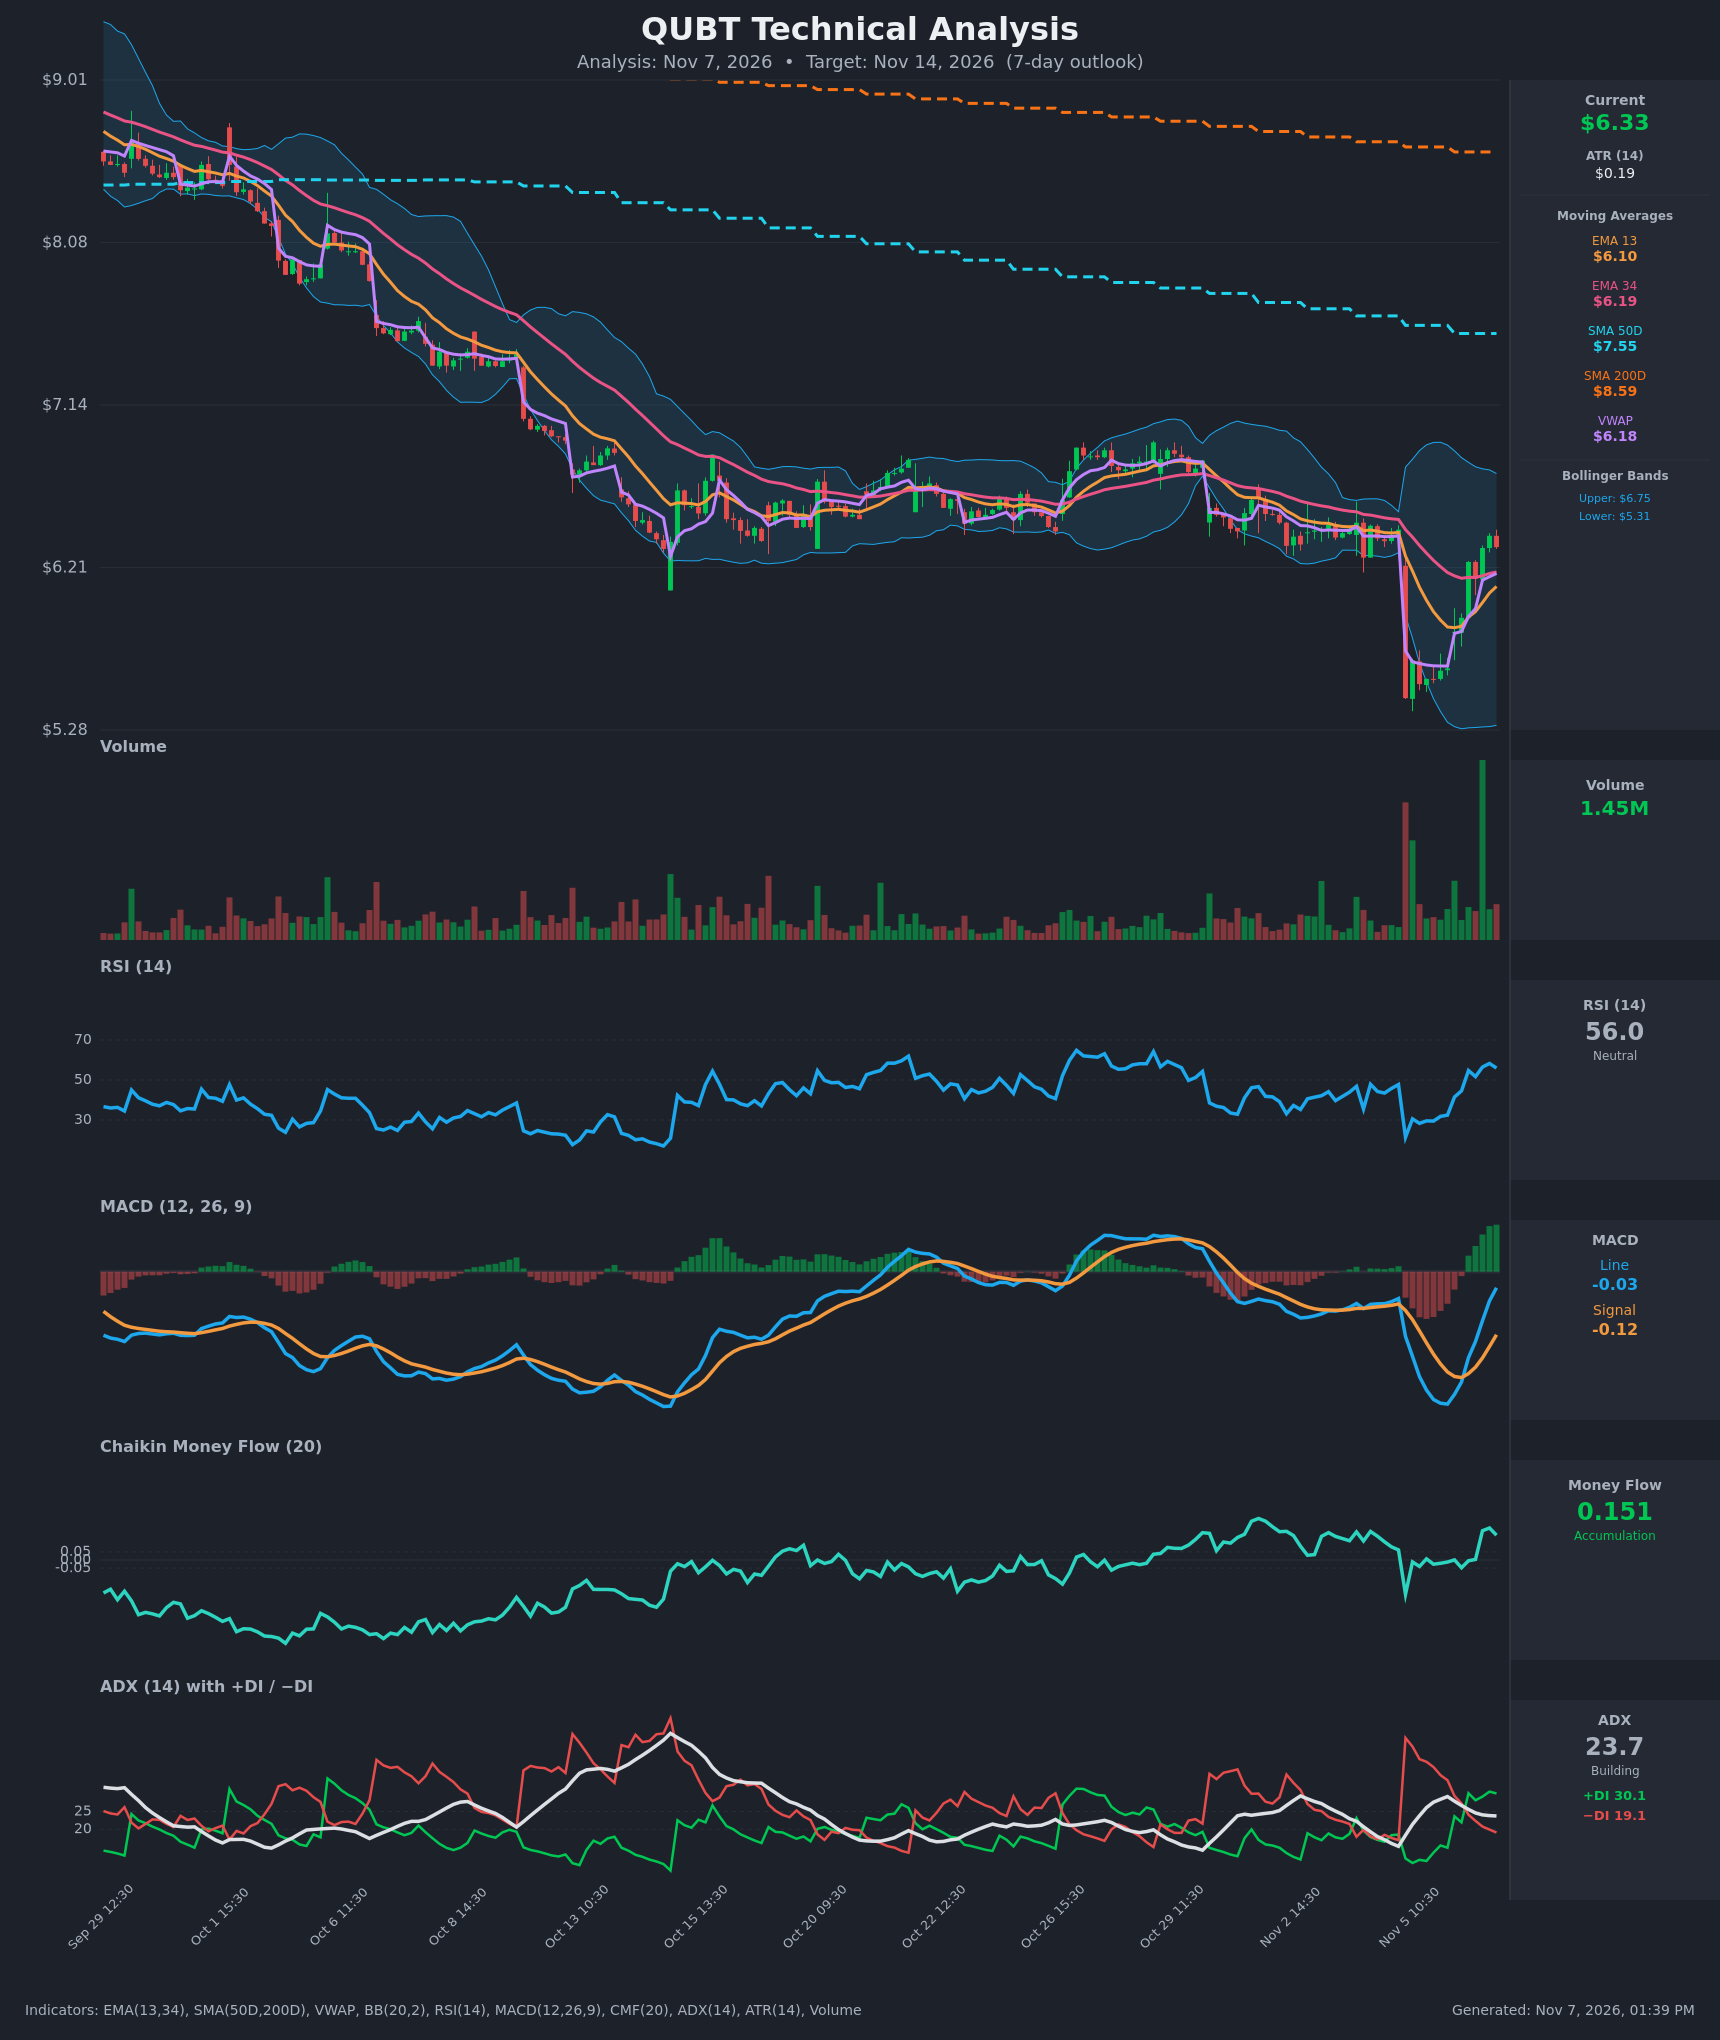
- RSI (14): 55.98, up sharply from an oversold 21.4 on Nov 5 and now above the 50 midline. Momentum is recovering but not overbought. [Bullish]
- EMA 13 / EMA 34 (short-term trend): Price at $6.33 is above EMA13 ($6.10) and EMA34 ($6.19), so both now act as support. EMA13 is still below EMA34, so the bullish cross has not happened yet, though the gap is narrowing quickly (from about -$0.60 to -$0.08). [Bullish]
- MACD: Line -0.0305 vs signal -0.1193. The line is above the signal, a bullish crossover from Nov 6, and the histogram is positive and expanding. Both lines are still below zero, so this is a recovery rather than a confirmed trend change. [Bullish]
- Bollinger Bands (20): Upper $6.75, lower $5.31, midline around $6.03. The bands are wide after the Nov 5 gap-down flush. Price bounced off the lower band and is in the upper half of the range, with room toward the upper band. [Bullish]
- CMF (20): 0.151, well above +0.05 and positive for a sustained stretch. Buyers have been accumulating through the dip. [Accumulation]
- ADX (14): 23.7, below the 25 threshold and fading from the 29 peak. +DI (30.1) is above −DI (19.1), so bulls control the direction. The bearish drive from the Nov 5 flush has reversed, but trend strength is only moderate. [Moderate Trend, Bullish direction]
- Volume: 1.45M, lower than the large spikes on the Nov 5 flush and the recovery bar. The rebound bars were green on elevated volume, which supports the bounce. Current participation is only average. [Mildly Bullish]
- VWAP / SMAs: Price is above VWAP ($6.18). It is far below SMA50D ($7.55) and SMA200D ($8.59), with a death cross already in place. The long-term trend is clearly down, and the SMAs act as overhead resistance. [Bearish long-term]
DIVERGENCES & TRENDS
- RSI made a higher low after the Nov 5 flush, and price held above the $5.40 area. This is a short-term bullish reversal rather than a classic divergence.
- The MACD bullish crossover came from deeply negative territory, with the histogram turning green and expanding. Short-term momentum has clearly flipped.
- CMF held positive through the entire selloff, which suggests accumulation underneath price.
- +DI crossed back above −DI on Nov 6. ADX is below 25 and slipping, so follow-through is not yet confirmed.
- Longer-term, price is in a persistent downtrend from about $8.50 to $6.20 with lower highs. SMA50D and SMA200D are both sloping down.
- The EMA13/EMA34 bullish cross is imminent but not yet confirmed.
CHART PATTERNS
- V-shaped recovery / failed breakdown: After the gap-down to about $5.40, price retraced the entire drop back to the $6.33 range. This is reversal behavior and is not a standard pattern from the diagram.
- Range consolidation / Bullish Falling Wedge (broader): The October consolidation of roughly $6.20–$6.90 resembles a base. A move above $6.75 (the upper Bollinger Band and prior range top) would target about $7.00–$7.20.
- Overhead resistance: There is a gap and supply zone around $6.50–$6.75, then SMA50D at $7.55.
POTENTIAL SCENARIOS
- Scenario 1: Bullish Continuation of the Recovery — Price holds above the EMAs, the EMA13/34 cross confirms, and price pushes toward the upper Bollinger Band. Trigger: hold above $6.20 and close above $6.50. Target: $6.75–$6.95. Invalidation: close below $6.00. (50% probability)
- Scenario 2: Neutral Consolidation Below Resistance — Price stalls beneath $6.50–$6.75 supply and chops between EMA support and resistance. Trigger: failure to clear $6.50 on volume. Target: $6.10–$6.55. Invalidation: close above $6.75 or below $6.00. (28% probability)
- Scenario 3: Bearish Rejection — The rally fades at overhead resistance and the long-term downtrend resumes. Trigger: a break below EMA13 at $6.10 and VWAP at $6.18. Target: $5.70–$5.50. Invalidation: close above $6.75. (22% probability)
PRICE TARGETS
Over 7 days, with ATR of $0.186, the typical weekly move is about ±$0.50. Expected range width is about 8% of price.
- Target Price: $6.58 (7-day)
- Expected Range: $6.10 to $6.95 ($0.85 width ≈ 13%)
- Key Levels: Support at $6.10, Resistance at $6.75
OVERALL BIAS
OVERALL BIAS: BULLISH - The MACD crossover, RSI recovery above 50, +DI over −DI, CMF accumulation and price above the EMAs and VWAP point to continued short-term recovery. Overhead supply near $6.75 and the declining SMAs cap the upside, so conviction is moderate.
This is educational analysis and not financial advice.