ARM 4-day bearish forecast — Nov 7, 2026
- Bias: Bearish
- Timeframe: 4 days (made Nov 7, 2026, target date Nov 10, 2026)
- Price at analysis: $174.53
- Price target: $171.00
- Expected range: $163.50 – $178.50
- Result: Incorrect (+4.0%) — closed at $181.49 on Nov 10, 2026; quality score 3/100
Get a free AI analysis of ARM today
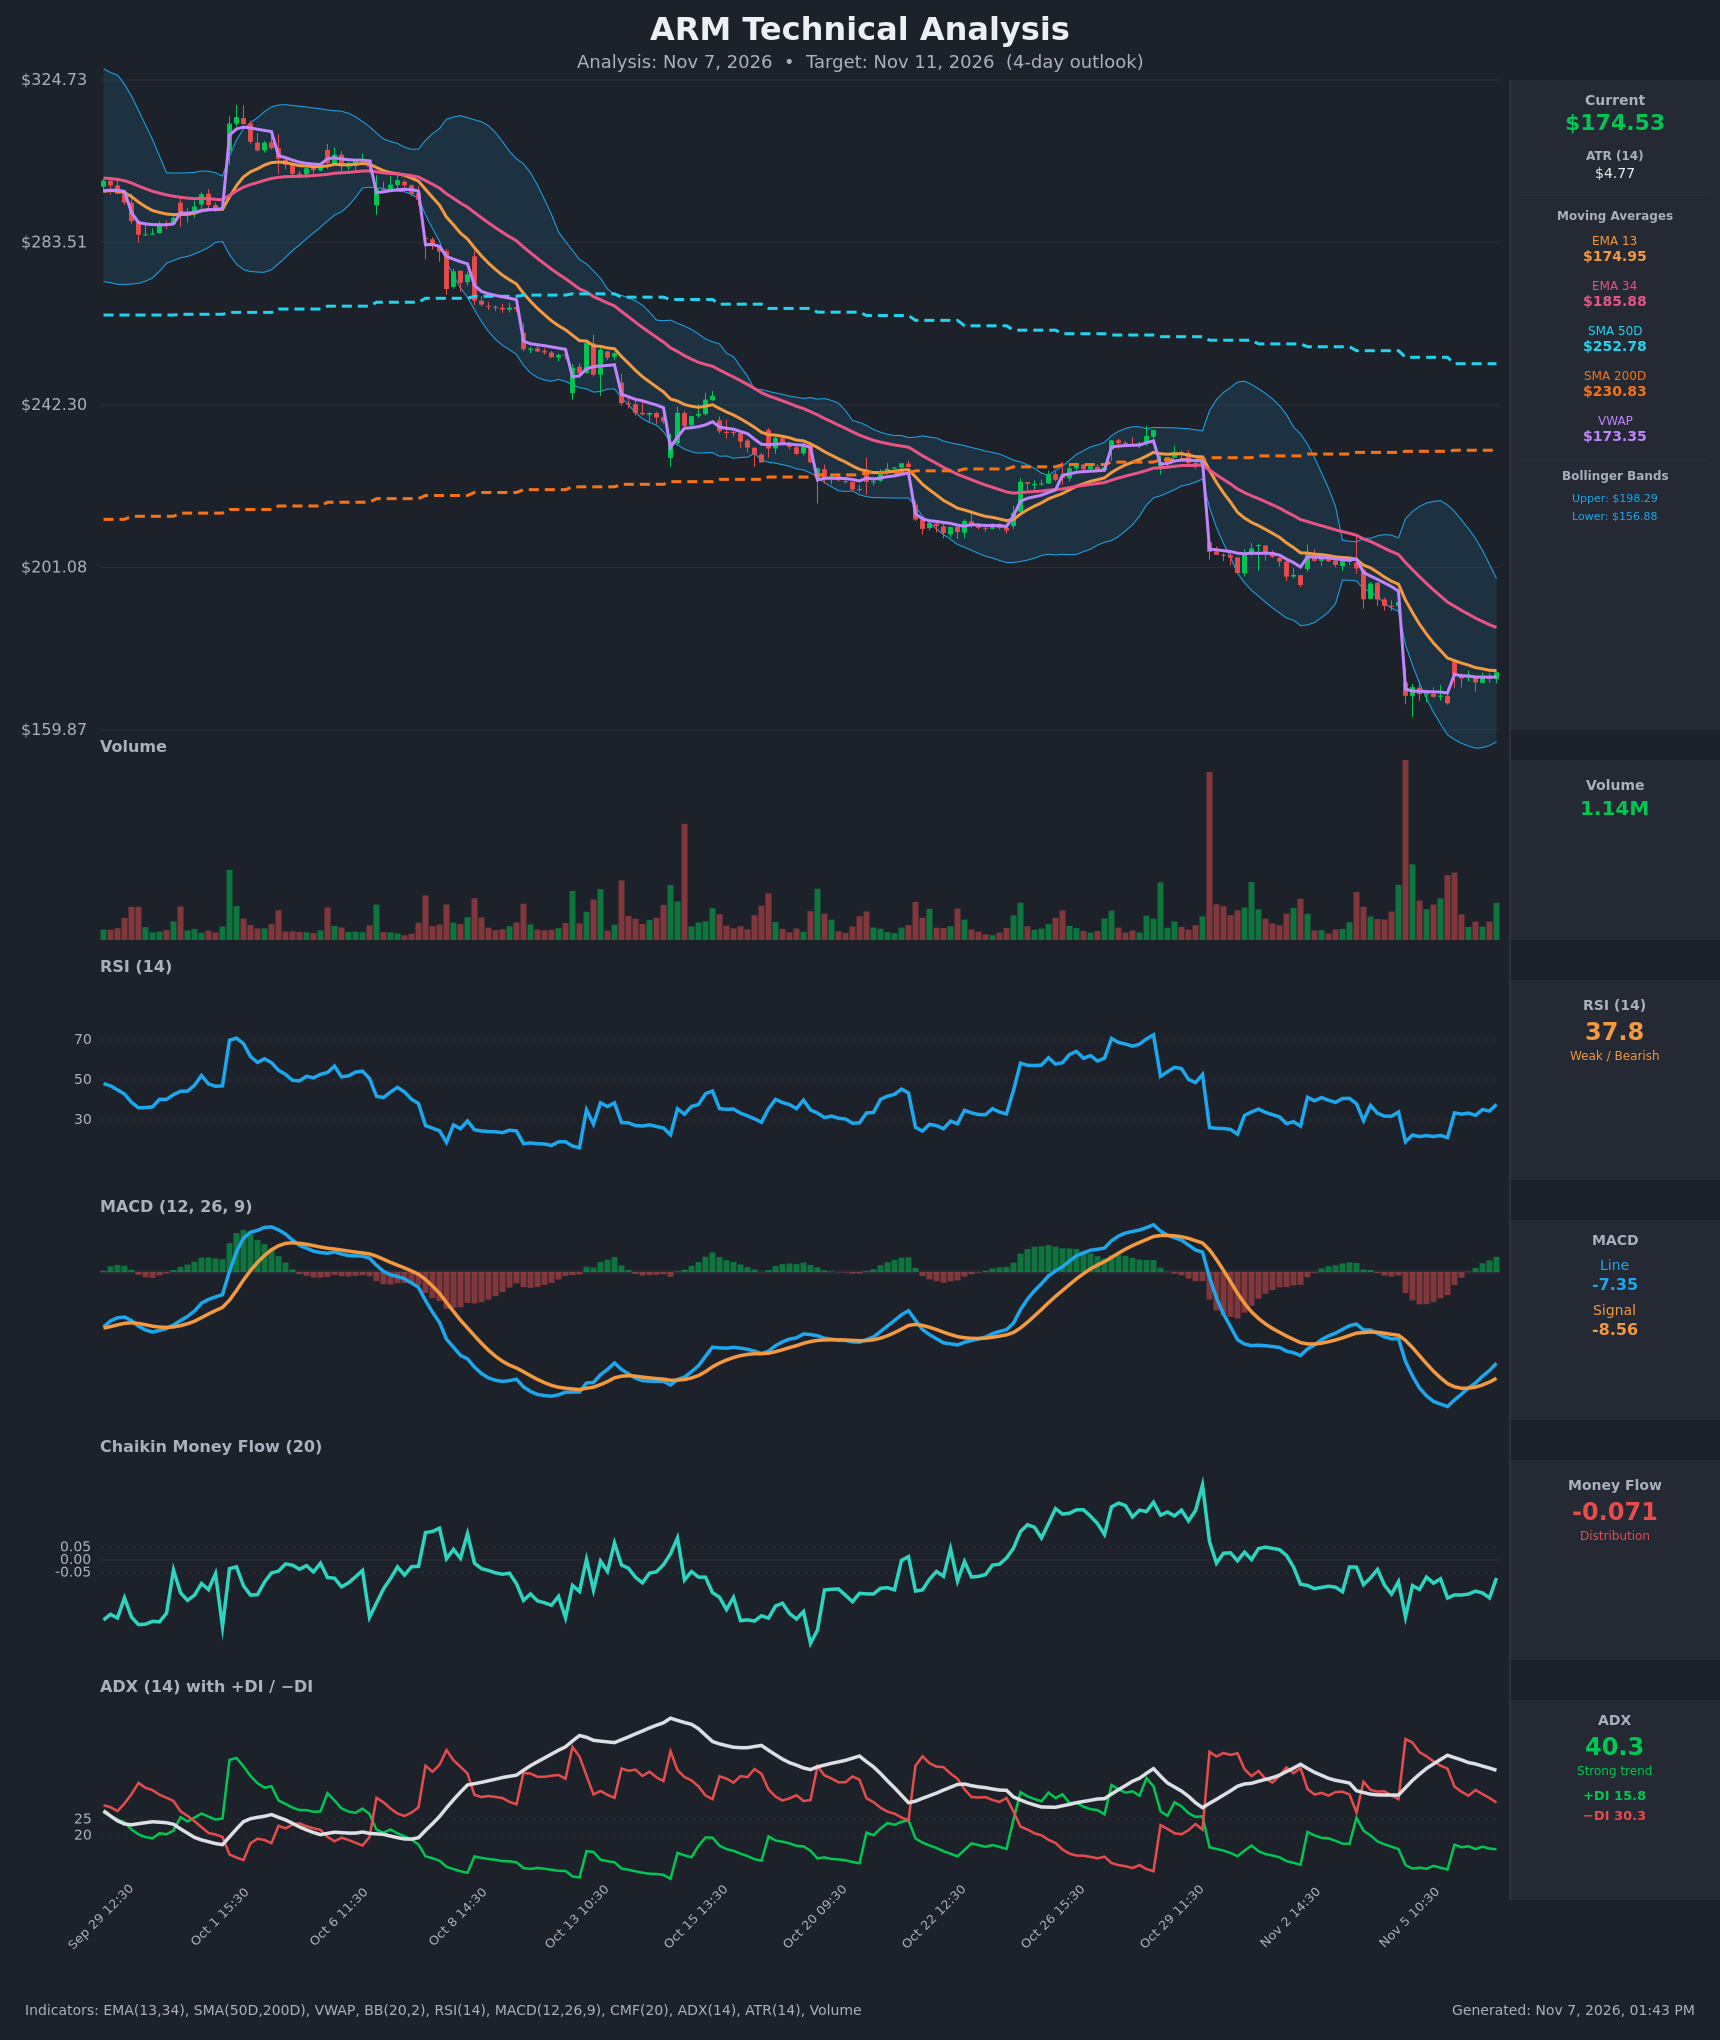
Analysis
TECHNICAL INDICATORS
- RSI (14): 37.78, rebounding from deeply oversold readings near 19-22 on Nov 5 but still below 50 and in bearish territory. Momentum is improving off the lows without any real strength yet. [Bearish]
- 20 EMA: The data gives EMA 13 at $174.95 and EMA 34 at $185.88. Price ($174.53) sits just under the EMA 13 and well below the EMA 34, which is falling and acts as overhead resistance. EMA 13 is below EMA 34, so the bearish alignment is intact. [Bearish]
- MACD: Line -7.35 is above signal -8.56, so the histogram is positive (+1.2) and rising. The line crossed above the signal around Nov 6 11:30, a bullish crossover that is still deep below zero. It signals a relief bounce, not a trend reversal. [Neutral]
- Bollinger Bands (20): Upper $198.29, lower $156.88, midline about $177.6. Price is in the lower half, just below the midline, after riding the lower band on the Nov 5 gap-down. The bands are wide after the volatility expansion. [Bearish]
- CMF (20): -0.071, below the -0.05 threshold, so distribution continues. It has ticked up from about -0.15 but remains negative. [Distribution]
- ADX (14): 40.3, a strong trend that is gradually easing from 45. -DI (30.3) is well above +DI (15.8), so bears are in control. The -DI is fading, which shows selling pressure is cooling. [Strong Trend – Bearish]
- Volume: 1.14M, light compared with the huge spike on the Nov 5 gap-down. The bounce is occurring on low volume, so it is not convincing. [Weak bounce, bearish-leaning]
DIVERGENCES & TRENDS
- MACD made a higher low (about -10.8 on Nov 5, now -7.35) while price only consolidated near $168-174, an early bullish momentum divergence. It is shallow and still below zero.
- RSI is recovering from sub-25 but remains under 40 and has not broken above its recent range.
- The MA structure is strongly bearish. Price is far below SMA200D ($230.83) and SMA50D ($252.78), and a death cross has already occurred, with SMA50D above SMA200D but converging downward. EMA 13 is below EMA 34.
- Price has stabilized at about $172-174 since the Nov 6 open and is hugging VWAP ($173.35), which signals balance after a capitulation gap.
- The ADX is falling from its peak and -DI is retreating, so downside momentum is slowing but not reversed.
CHART PATTERNS
- The broader chart shows a long, steady descent of lower highs and lower lows, with gap-downs on Oct 29 and Nov 5, which is a downtrend continuation structure.
- The recent tight sideways drift of about $168-175 after the gap resembles a small Bearish Flag/Pennant (continuation). A breakdown below $168 would project toward roughly $160, and a measured move could reach $155.
- A tentative Bullish Falling Wedge/Double Bottom is also possible at $166-168 (Nov 5 lows retested), but it is not confirmed. It needs a close above the EMA 13/midline near $177-178 and then $186.
POTENTIAL SCENARIOS
- Scenario 1: Bearish Flag Breakdown — The low-volume bounce stalls at the EMA 13/Bollinger midline, and sellers push price back toward the Nov 5 lows and the lower band. Trigger: break below $168 on rising volume. Target: $160-164. Invalidation: a close above $180. (45% probability)
- Scenario 2: Bullish Relief Bounce — The MACD crossover and oversold RSI rebound extend, with price reclaiming the EMA 13 and midline. Trigger: close above $178. Target: $183-186 (EMA 34). Invalidation: a break below $168. (30% probability)
- Scenario 3: Neutral Consolidation — Price chops around VWAP between $167 and $179 as volatility compresses. Trigger: failure to break either side. Target: $172-176. Invalidation: a close outside $166-$181. (25% probability)
PRICE TARGETS
For a 4-day horizon, ATR is $4.77 and the 3-4 day range guidance is about 2-4% on the low end and up to roughly 4-8% for longer. I am using about 8% width given the elevated volatility.
- Target Price: $171.00
- Expected Range: $163.50 to $178.50 (width $15.00, about 8.6% of price)
- Key Levels: Support at $168.00, Resistance at $178.00
OVERALL BIAS
OVERALL BIAS: BEARISH - Price remains below all key moving averages with -DI dominant, ADX at 40, and persistent distribution (CMF -0.071). The bounce is on light volume and faces resistance at the EMA 13 and the EMA 34 above, though the MACD crossover and recovering RSI limit the downside.
This is educational analysis and not financial advice.