ARM 7-day bearish forecast — Nov 7, 2026
- Bias: Bearish
- Timeframe: 7 days (made Nov 7, 2026, target date Nov 13, 2026)
- Price at analysis: $174.53
- Price target: $170.00
- Expected range: $164.00 – $178.00
- Result: Incorrect (+7.1%) — closed at $186.89 on Nov 13, 2026; quality score 0/100
Get a free AI analysis of ARM today
Analysis
TECHNICAL INDICATORS
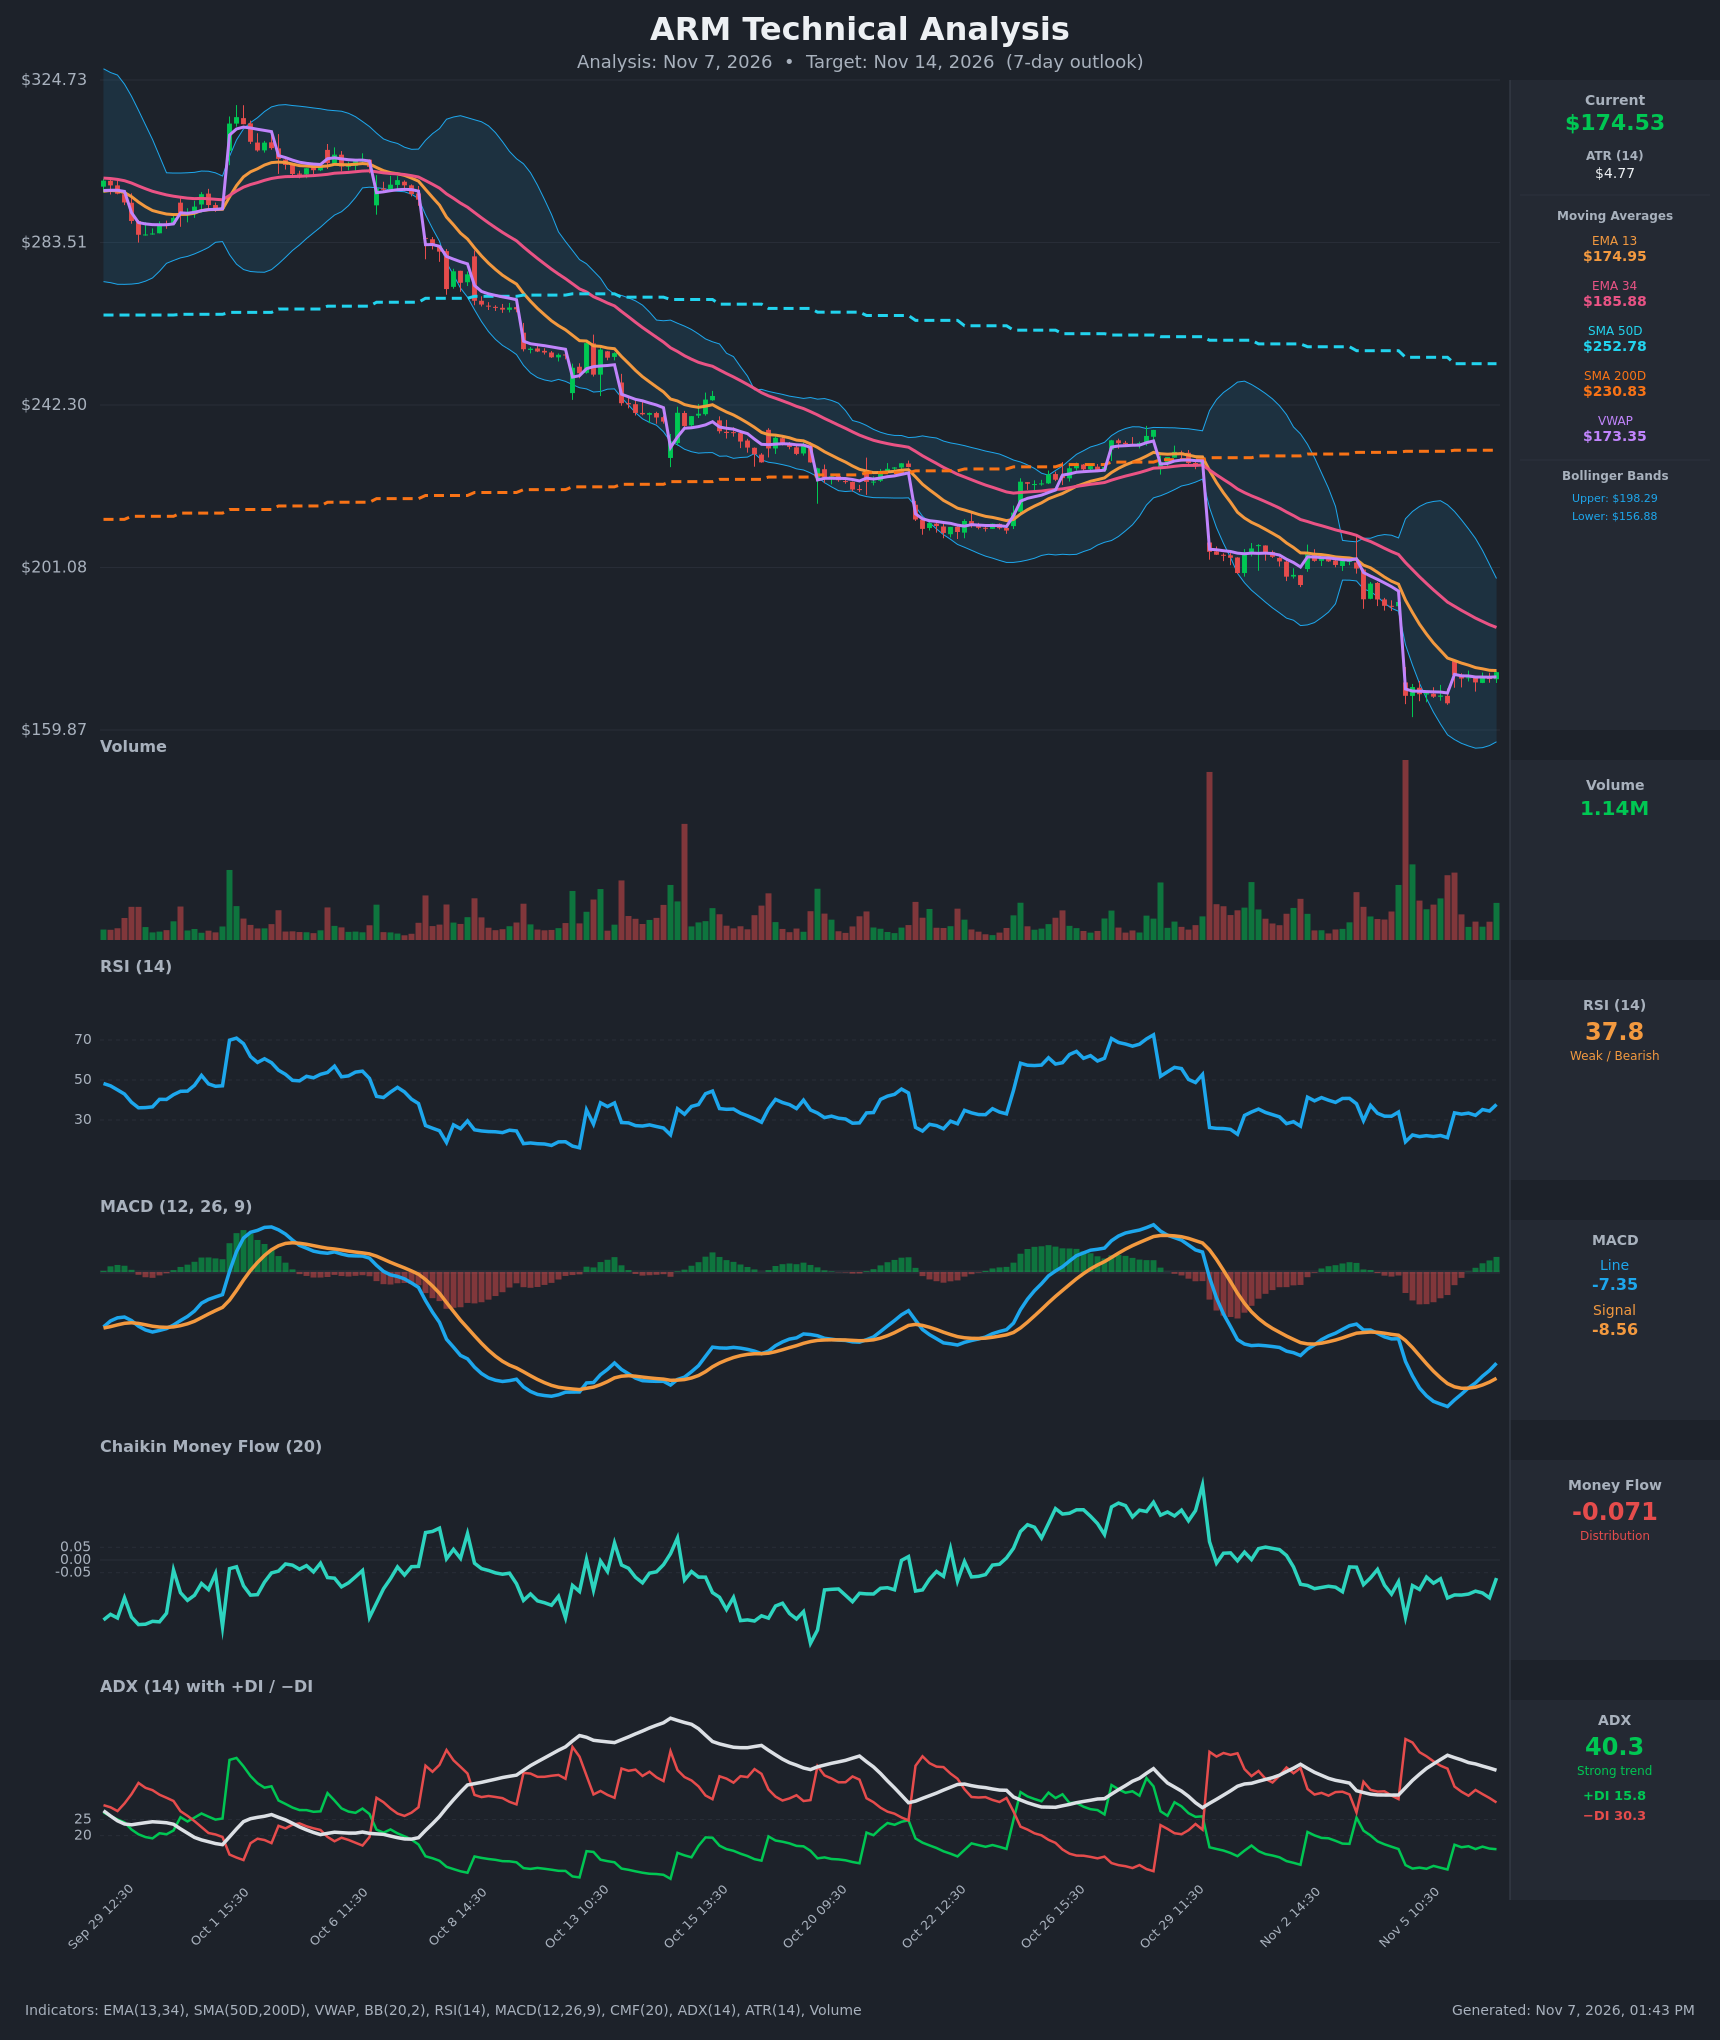
- RSI (14): 37.78, up from an extreme oversold reading of about 19-22 on Nov 5. It is rebounding but still well below 50, and the 30-45 area has capped earlier bounces. Momentum is improving from a washed-out low, but it is not yet a bullish regime. [Bearish]
- 20 EMA: No 20 EMA is supplied, so I use the EMA 13 at $174.95 and the EMA 34 at $185.88. Price ($174.53) sits right at the EMA 13, which is flat to slightly rising. The EMA 34 is steeply falling and is overhead resistance. EMA 13 is below EMA 34 and the gap is about $11, so the bearish stack is intact. [Bearish]
- MACD: Line -7.35, signal -8.56, histogram about +1.2. MACD crossed above its signal around Nov 6 11:30, a bullish crossover, and the histogram is turning positive. Both lines are still deep below zero, so this is a relief signal inside a downtrend, not a trend change. [Bullish]
- Bollinger Bands (20): Upper $198.29, lower $156.88, midline about $177.60. Price is in the lower half, about $17.6 above the lower band and $3 below the midline. The bands are wide after the Nov 5 gap-down, which signals high volatility. Price has stepped back off the lower band, but the midline is untested overhead resistance. [Neutral]
- CMF (20): -0.071, below the -0.05 threshold, and it has been negative for most of the past week. It ticked up from -0.15 but still shows distribution. [Distribution]
- ADX (14): 40.3, a strong trend, but it is rolling over from 45. −DI at 30.3 is far above +DI at 15.8. The gap is narrowing as −DI falls from 50 and +DI recovers from about 10. Bears still control, but selling pressure is fading. [Strong Trend – Bearish]
- Volume: 1.14M on the latest bar, light compared with the huge spikes on the Nov 5 gap-down. The bounce is happening on subdued volume, so there is little conviction behind the relief rally. [Weak bounce / Neutral-Bearish]
DIVERGENCES & TRENDS
- Bullish momentum divergence: price made a low around $166.64 on Nov 5, while MACD kept falling until about Nov 5 15:30 and has since turned up. RSI is also recovering from 21 to 38. This is a short-term momentum improvement, not a classic price divergence.
- VWAP: price at $174.53 is above VWAP ($173.35), a modest intraday buyer edge.
- Moving averages: price is below the EMA 34, SMA 50D ($252.78) and SMA 200D ($230.83), so the long-term trend is down. The SMA 50D is rolling over toward the SMA 200D, and a death cross is a real possibility if weakness persists. No golden or death cross has occurred yet.
- Crossovers: MACD crossed bullishly on Nov 6. There is no DI crossover, and −DI is still about 2x +DI.
- Trend structure: a lower-high, lower-low staircase from $320 to $166, with gap-downs on Oct 29 and Nov 5 followed by sideways consolidation each time.
CHART PATTERNS
- Bearish Flag / Pennant (continuation): after the sharp Nov 5 gap-down, price has consolidated in a tight $167-$175 range. If this resolves downward, the measured move targets the low $150s and the lower band area near $157.
- Bullish Falling Wedge / Double Bottom (reversal): the Nov 5 low near $166.6 and the shallower Nov 6 dip around $172 hint at a small base. Confirmation needs a close above about $177.60 (BB midline) and then the $185.88 EMA 34. That is not yet in place.
- Gap-down pattern: the Nov 5 gap from $192 to $168 leaves a gap-fill zone at $185-$192, which would be the bounce ceiling.
- On balance the flag-style consolidation under falling averages fits the bearish continuation pattern better.
POTENTIAL SCENARIOS
- Scenario 1: Bearish Flag Breakdown — the post-gap consolidation fails at the BB midline and EMA resistance, and the strong −DI-led trend resumes. Trigger: rejection near $177-$178, then a close below $166.60. Target: $165-$170 within 7 days, with an extension toward $157 (lower BB). Invalidation: a daily close above $178 with rising volume. (50% probability)
- Scenario 2: Bullish Relief Bounce — the MACD bullish cross, rising RSI and the price hold above VWAP and EMA 13 lead to a mean-reversion rally in an oversold market. Trigger: a break above $177.60 on increased volume. Target: $185-$186 (EMA 34), with an outside shot at the gap-fill zone near $192. Invalidation: a close back below $171.50. (35% probability)
- Scenario 3: Neutral Range Chop — price oscillates between $167 and $178 while ADX cools and the indicators reset. Trigger: failure of both breakout levels. Target: $172-$176. Invalidation: a close outside $166-$178. (15% probability)
PRICE TARGETS
- Target Price: $170.00 (7-day)
- Expected Range: $164.00 to $178.00 ($14 width ≈ 8.0% of the current price, in line with the 7-10 day guidance)
- Key Levels: Support at $166.60, Resistance at $177.60
OVERALL BIAS
OVERALL BIAS: BEARISH - The price is in a strong, ADX-confirmed downtrend with −DI dominant, sits below every major moving average, and shows distribution on CMF. The bounce has come on light volume into overhead resistance at the BB midline and EMA 34. The fresh MACD cross and the RSI rebound argue for a possible relief rally, which keeps conviction modest.
This is educational analysis and not financial advice.