MSTR 223-day bearish forecast — Nov 7, 2026
- Bias: Bearish
- Timeframe: 223 days (made Nov 7, 2026, target date Jun 17, 2027)
- Price at analysis: $128.93
- Price target: $110.00
- Expected range: $90.00 – $135.00
- Result: Pending — graded after the close on Jun 17, 2027
Get a free AI analysis of MSTR today
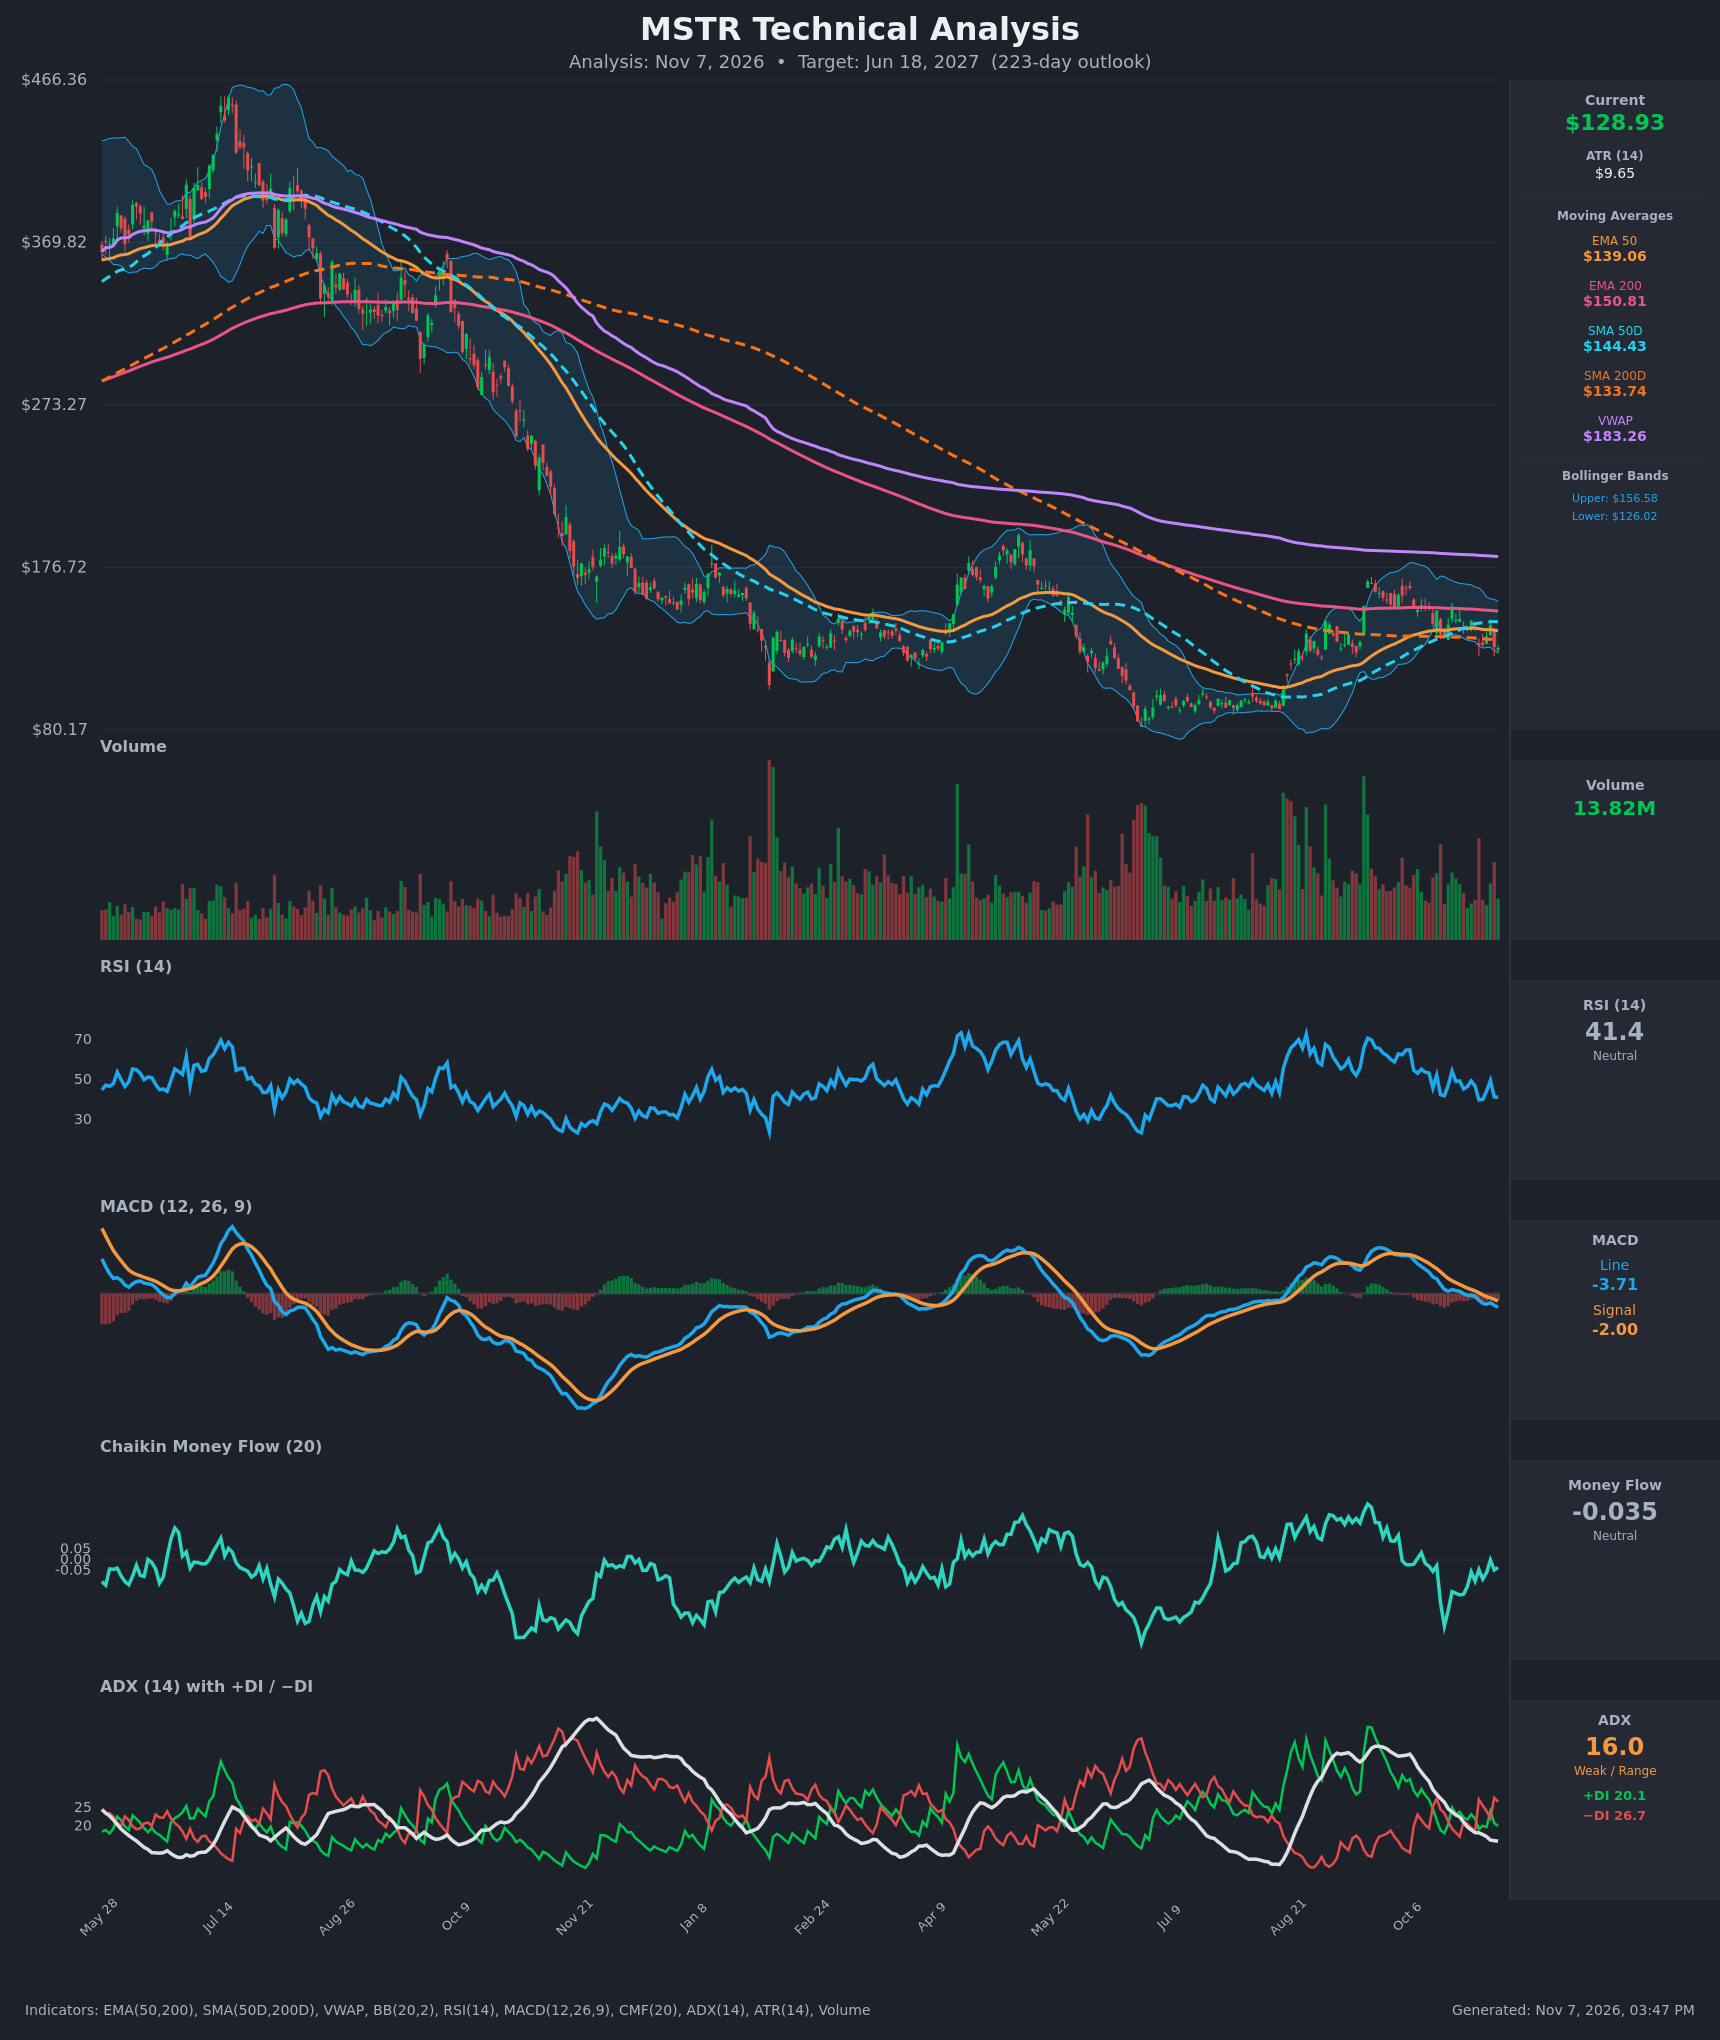
Analysis
TECHNICAL INDICATORS
- RSI (14): 41.35, below the 50 midline but above oversold (30). It has fallen from 49.7 on Nov 4 and keeps failing near 50 on rallies, with no oversold washout yet. Momentum is soft and leaning down. [Bearish]
- 20 EMA: No 20 EMA value was supplied. The nearest proxy is the 50 EMA at $139.06, which price ($128.93) sits about 7% below. The 50 EMA is sloping down, and every rally since Oct 21 has stalled around it, so it acts as resistance. [Bearish]
- MACD: The line (-3.708) is below the signal (-1.997) and below zero. The histogram is about -1.71 and widening, since the line fell from +1.1 on Oct 19. The bearish crossover is established and still deepening. [Bearish]
- Bollinger Bands (20): The upper band is $156.58 and the lower is $126.02, with the midline near $141.30. Price is only about $3 above the lower band, in the bottom ~10% of the range. This shows downside pressure, though a bounce toward the midline is possible. There is no band-walk yet, and the bands are moderately narrow. [Bearish]
- CMF (20): -0.035, inside the ±0.05 neutral zone. It has recovered from -0.31 on Oct 19 and touched 0.000 on Nov 4, but it has not turned into accumulation. [Neutral]
- ADX (14): 16.0 and falling from 26.6, so there is no strong trend at the moment. −DI (26.7) is above +DI (20.1), and the DI lines crossed bearishly on Nov 5. Sellers hold a modest edge inside a weak, choppy trend. [Weak Trend, Bearish lean]
- Volume: 13.82M, with no clear expansion on the latest drop. Recent down days show sporadic heavy red bars, and the Aug-Sep rally had much larger bars than current sessions. Participation is fading on bounces and picking up on declines. [Mildly bearish]
DIVERGENCES & TRENDS
- Moving-average structure: Price ($128.93) is below the 50 EMA ($139.06), 200 EMA ($150.81), SMA50D ($144.43), SMA200D ($133.74) and VWAP ($183.26), so it is below every average. The 50 EMA has stayed below the 200 EMA for the whole window, which is a persistent bearish structure.
- SMA cross: The SMA50D crossed above the SMA200D around Oct 19, a golden cross on paper. It is a lagging, weak signal, because price has since fallen below both and the SMA50D peaked at $144.60 on Nov 5 and is rolling over. A failure here would turn the cross into a whipsaw and a bearish trap for bulls.
- No bullish divergence: RSI is making lower highs (54.5 → 49.7 → 41.6) alongside lower price highs. There is no bullish divergence yet.
- Lower highs on the larger chart: The rallies peaked near $200 in Apr-May and near $175 in Sep. Both are lower highs inside a multi-year decline from $466 to the ~$80-90 lows.
- MACD has been below its signal and is now below zero, with the gap widening.
- ADX is falling, so the market is range-like, but the DI crossover favors bears.
- CMF is improving but stuck in neutral.
CHART PATTERNS
- Bearish Rising Wedge / Lower-high structure (loosest match): The recovery from the ~$85 low to ~$175, followed by a sequence of lower highs, looks like a rally that has lost momentum. Rejection near the 50 EMA and SMA50D supports a resumption lower.
- Bearish Pennant / Flag (continuation) in the short term: The recent tight range of about $128–$153 after the prior drop would resolve downward if price closes below ~$126 (the lower Bollinger Band and the Oct 30 low area). The measured move points toward the $100–$110 zone.
- Bullish counter-case (Double Bottom / Falling Wedge): The prior lows around $85–$100 could form a base for a double bottom if retested and held. That would need a close back above the $139–$145 resistance cluster, which is not yet confirmed.
POTENTIAL SCENARIOS
- Scenario 1: Bearish Breakdown and Retest of the Lows — Price is below all major averages with a deepening MACD and −DI dominance. It loses the lower Bollinger Band and trends toward the $100–$110 area, possibly retesting the prior base in the $85–$100 zone over the 223 days. Trigger: daily close below $126, then below $120. Target: $105–$112. Invalidation: weekly close above $145 (SMA50D) with MACD crossing back above signal. (50% probability)
- Scenario 2: Neutral Range Chop — The weak ADX (16) persists and price oscillates between about $110 and $145, pinned by the SMA200D and EMA50 above and the lower band and prior lows below. Trigger: failure to close decisively beyond either $126 or $140. Target: $120–$135. Invalidation: a decisive close outside $105–$150. (22% probability)
- Scenario 3: Bullish Reclaim and Trend Reversal — Price holds the $126 area, reclaims SMA200D ($133.74), then clears EMA50 ($139) and SMA50D ($144). It extends to the EMA200 ($151) and then the $175 prior high. Trigger: close above $145 with a MACD bullish cross and CMF above +0.05. Target: $150–$175. Invalidation: a close back below $126. (28% probability)
PRICE TARGETS
For a 223-day horizon (181–365 day band, 25–40% width), the range is $90.00 to $135.00, a $45 width or about 34.9% of the $128.93 current price. That fits the guidance.
- Target Price: $110.00 (about 14.7% below current)
- Expected Range: $90.00 to $135.00
- Key Levels: Support at $100.00, Resistance at $133.74
OVERALL BIAS
OVERALL BIAS: BEARISH - Price is below every moving average and VWAP, MACD is below its signal and zero with a widening negative histogram, and −DI is above +DI. Rallies keep failing at lower highs near the EMA50 and SMA50D, so a drift toward the $100–$110 area is the most probable outcome. A reclaim of $145 would invalidate this.
This is educational analysis and not financial advice.