IREN 6-day bullish forecast — Nov 8, 2026
- Bias: Bullish
- Timeframe: 6 days (made Nov 8, 2026, target date Nov 13, 2026)
- Price at analysis: $21.64
- Price target: $22.15
- Expected range: $20.85 – $22.55
- Result: Incorrect (-18.2%) — closed at $17.70 on Nov 13, 2026; quality score 0/100
Get a free AI analysis of IREN today
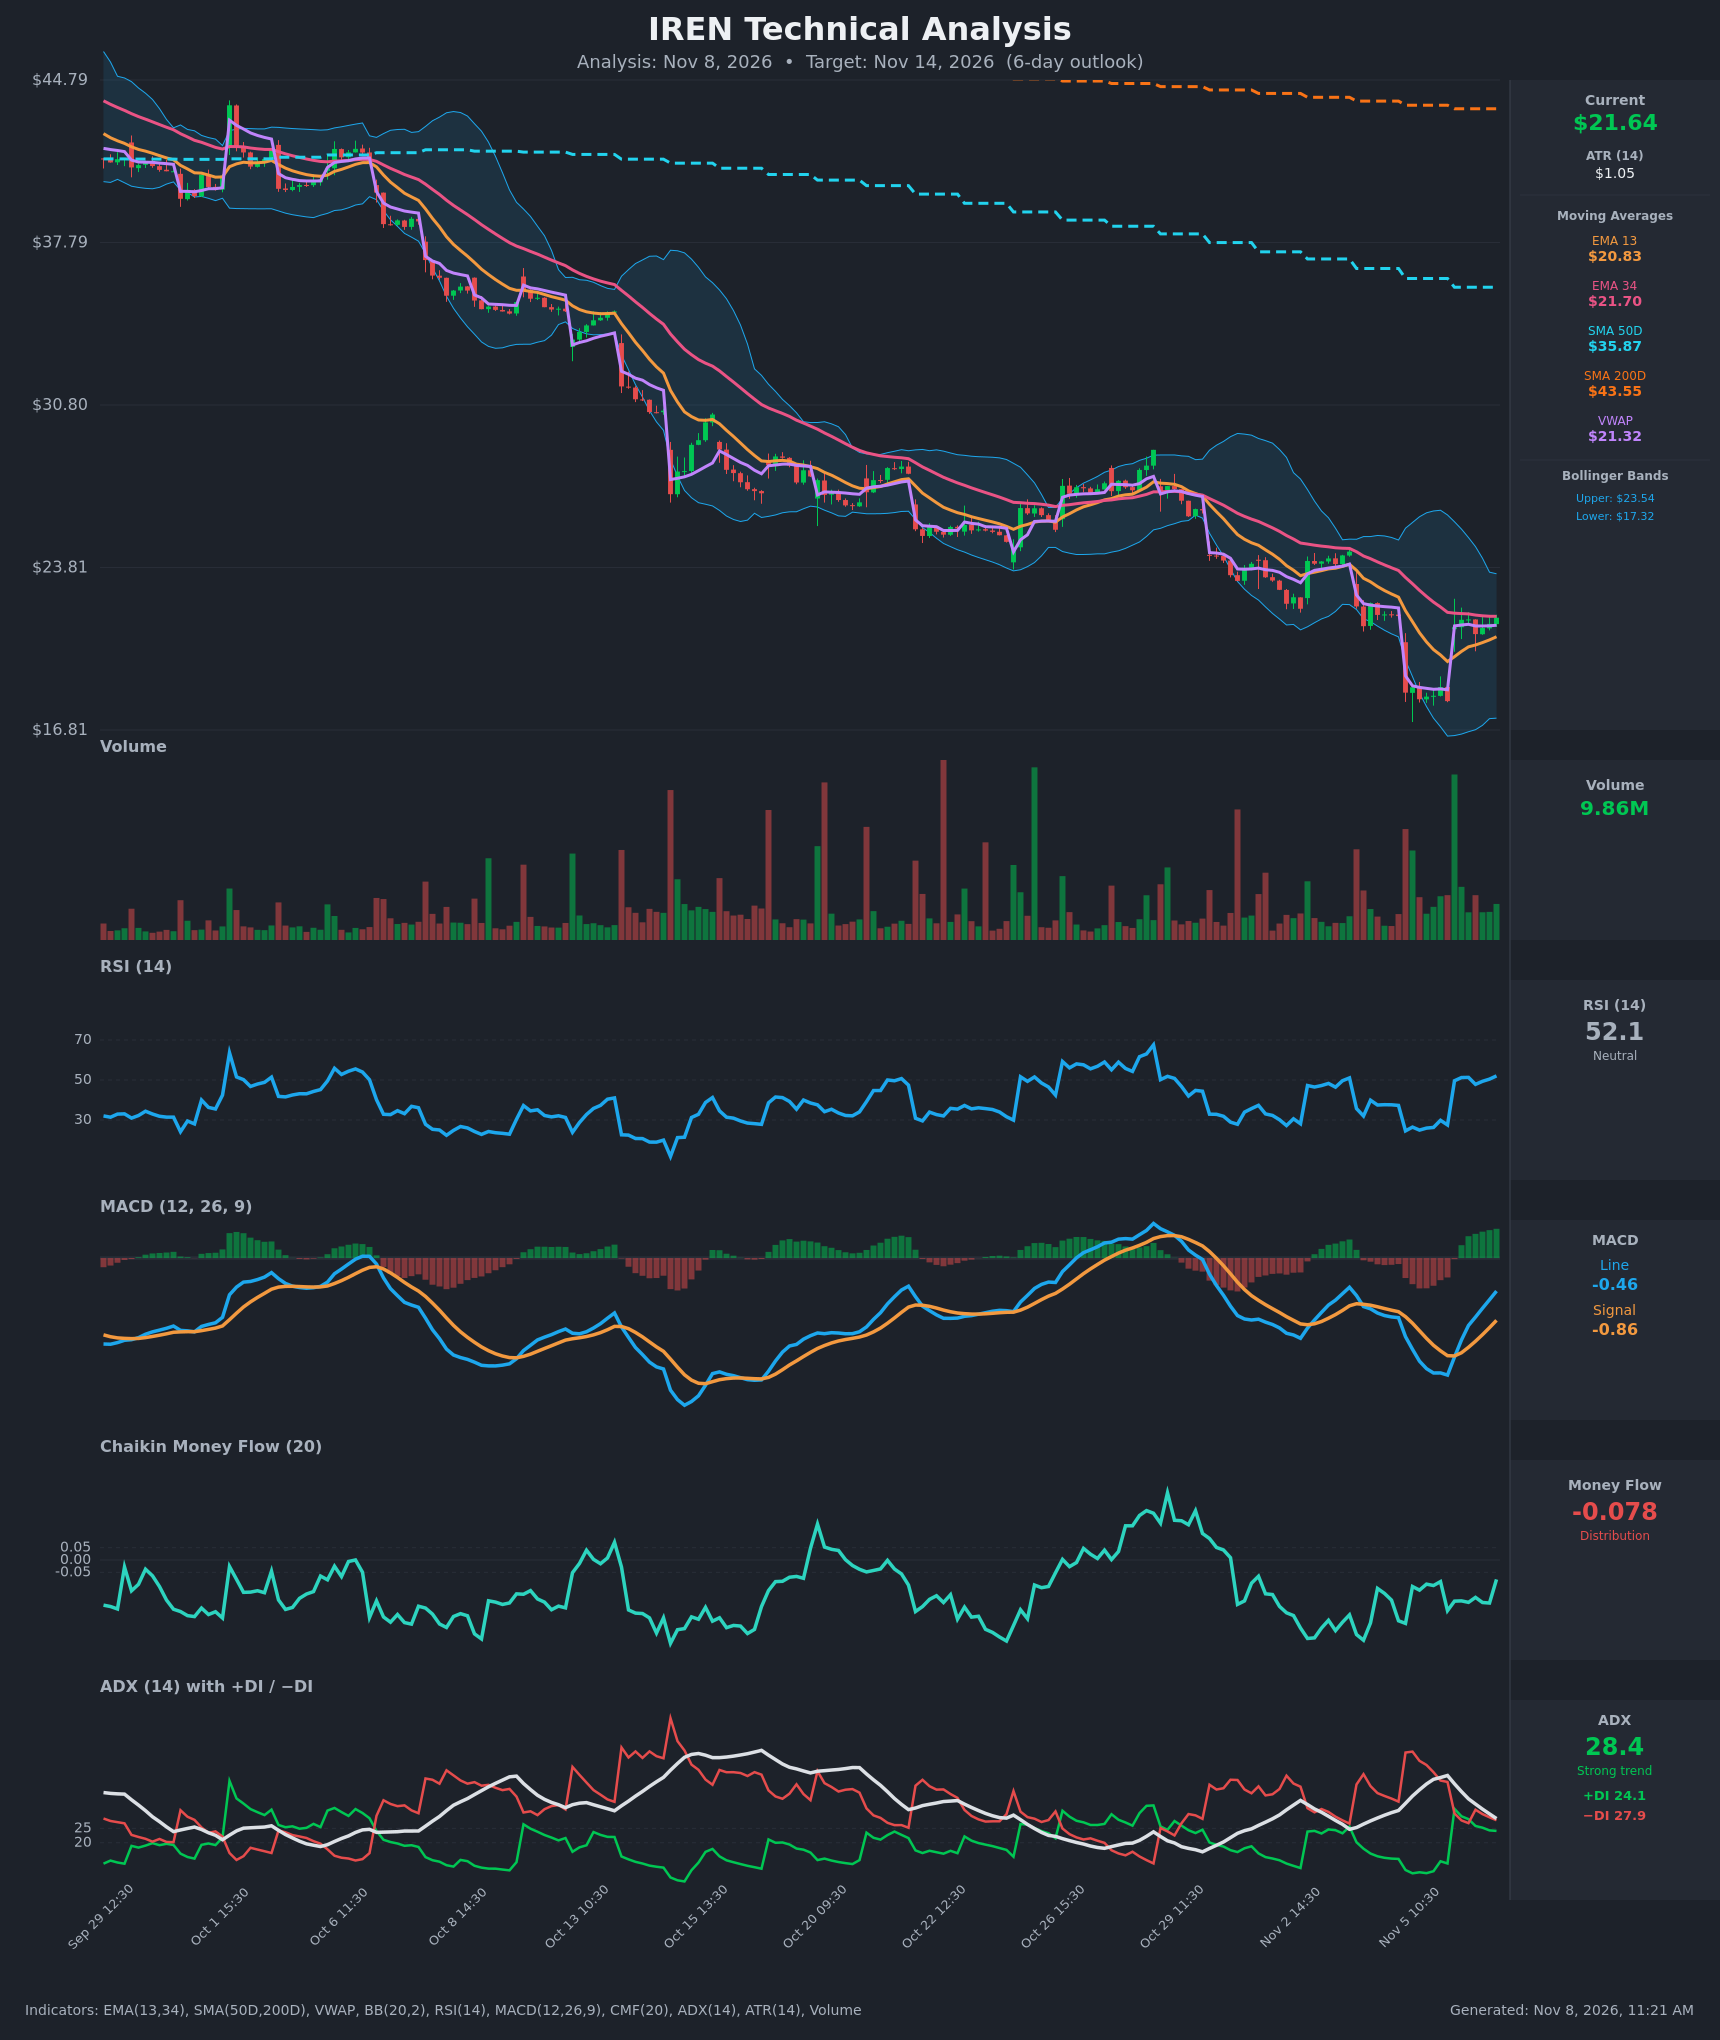
Analysis
TECHNICAL INDICATORS
- RSI (14): 52.06, up from 24-27 on Nov 5 and now back near the 50 midline. Momentum has recovered, but there is no overbought or oversold edge. [Neutral]
- 20 EMA: The chart shows EMA 13 ($20.83) and EMA 34 ($21.70). Price ($21.645) is above EMA 13, which is rising and acting as support. It sits just under EMA 34 (+0.05 away), which is the first overhead resistance. EMA 13 remains below EMA 34, so there is no bullish cross yet. [Neutral]
- MACD: Line -0.455 vs signal -0.859, a positive histogram of about +0.40. The line crossed above the signal on Nov 6 09:30 and the histogram is expanding. Both lines are still below zero, so this is a counter-trend recovery signal. [Bullish]
- Bollinger Bands (20): Upper $23.54, lower $17.32, midline about $20.43. Price is in the upper half of the bands after bouncing off the lower band. The bands are wide (high volatility), and the next band target is about $23.5. [Bullish]
- CMF (20): -0.078, below the -0.05 threshold, so mild distribution. It has improved from -0.25 but has not turned positive. Volume-weighted flow doesn't yet confirm the bounce. [Distribution]
- ADX (14): 28.4 and falling from 43.5, so the prior downtrend is losing strength. −DI (27.9) is still above +DI (24.1), but the gap has narrowed from 30+ points to about 4. A +DI/−DI crossover is possible soon. [Strong but Weakening Trend, Bearish bias]
- Volume: 9.86M, average to slightly elevated. The gap-up on Nov 6 came on a large green volume bar, and the hours since have seen modest, mostly green volume. This suggests real buying interest, but not a decisive breakout. [Mildly Bullish]
DIVERGENCES & TRENDS
- Bullish momentum shift: Price made a low near $18 on Nov 5 with RSI at 24.6. RSI has since recovered to 52, and MACD has crossed up from deeply negative levels.
- Higher-timeframe trend is still down: SMA 50D ($35.87) and SMA 200D ($43.55) are far above price, and the 50D is below the 200D (death cross in effect). Price is about 40% below the 50D, so major rallies are likely to meet supply.
- Price vs VWAP: Price is above VWAP ($21.32) with a tight, flat consolidation at $21.2-$21.7. The Nov 6 gap held, which is constructive.
- ADX/DI: Trend strength is fading and the DIs are converging, which signals a bearish trend in exhaustion rather than a confirmed reversal.
- CMF: Still negative and not confirming the price bounce. This is a mild non-confirmation that argues for caution.
CHART PATTERNS
- Possible Bullish Falling Wedge / descending channel (larger scale): Lower highs and lower lows since early October, with a sharp flush to the lower band and an immediate reclaim. The wedge's breakout target is a retest of the upper band near $23.5.
- Short-term consolidation under EMA 34: The tight range at $21.2-$21.7 after the gap resembles a small flag or pennant base. A break above $21.70-$22.00 would target about $23.0-$23.5. A failure below $20.83 would point back to the gap area near $18.5-$19.
- Overall: The decline is a lower-high, lower-low structure, and the bounce has not yet broken the sequence of lower highs (the previous swing high was around $24-$24.5).
POTENTIAL SCENARIOS
- Scenario 1: Bullish Bounce Extension — MACD is crossing up, price is holding above VWAP and EMA 13, and ADX is fading. Price breaks EMA 34 and pushes toward the upper Bollinger Band zone. Trigger: close above $21.70-$22.00 on rising volume. Target: $22.50-$23.50. Invalidation: close below $20.83 (EMA 13). (45% probability)
- Scenario 2: Bearish Rejection at EMA 34 — The long-term downtrend resumes, −DI stays on top, and CMF stays negative, so the bounce fades as lower-high resistance holds. Trigger: rejection at $21.70-$22.00 and a break below VWAP ($21.32) then EMA 13 ($20.83). Target: $19.50-$20.00, with the gap zone near $18.50 as the extension. Invalidation: close above $22.50. (35% probability)
- Scenario 3: Neutral Range Chop — Price consolidates between EMA 13 and EMA 34 while the indicators reset. Trigger: failure to break either $20.83 or $22.00. Target: $21.00-$22.00. Invalidation: a close outside that range on strong volume. (20% probability)
PRICE TARGETS
Width check: the range is $22.55 − $20.85 = $1.70, or about 7.9% of the current $21.645. That fits the 7-10 day guidance (4-8%) and is wider than a 2-3 day range.
- Target Price: $22.15 (6 days)
- Expected Range: $20.85 to $22.55
- Key Levels: Support at $20.83 (EMA 13), Resistance at $23.54 (upper Bollinger Band; minor resistance at $21.70 EMA 34)
OVERALL BIAS
OVERALL BIAS: BULLISH - A fresh MACD bullish crossover, RSI recovering from deeply oversold, price holding above VWAP and EMA 13, and fading ADX favor a modest continuation of the bounce toward $22+. Conviction is limited by the persistent distribution (CMF), −DI still above +DI, and heavy overhead resistance from the downtrend.
This is educational analysis and not financial advice.