IREN 4-day bullish forecast — Nov 8, 2026
- Bias: Bullish
- Timeframe: 4 days (made Nov 8, 2026, target date Nov 11, 2026)
- Price at analysis: $21.64
- Price target: $22.10
- Expected range: $20.90 – $22.40
- Result: Incorrect (-3.7%) — closed at $20.84 on Nov 11, 2026; quality score 19/100
Get a free AI analysis of IREN today
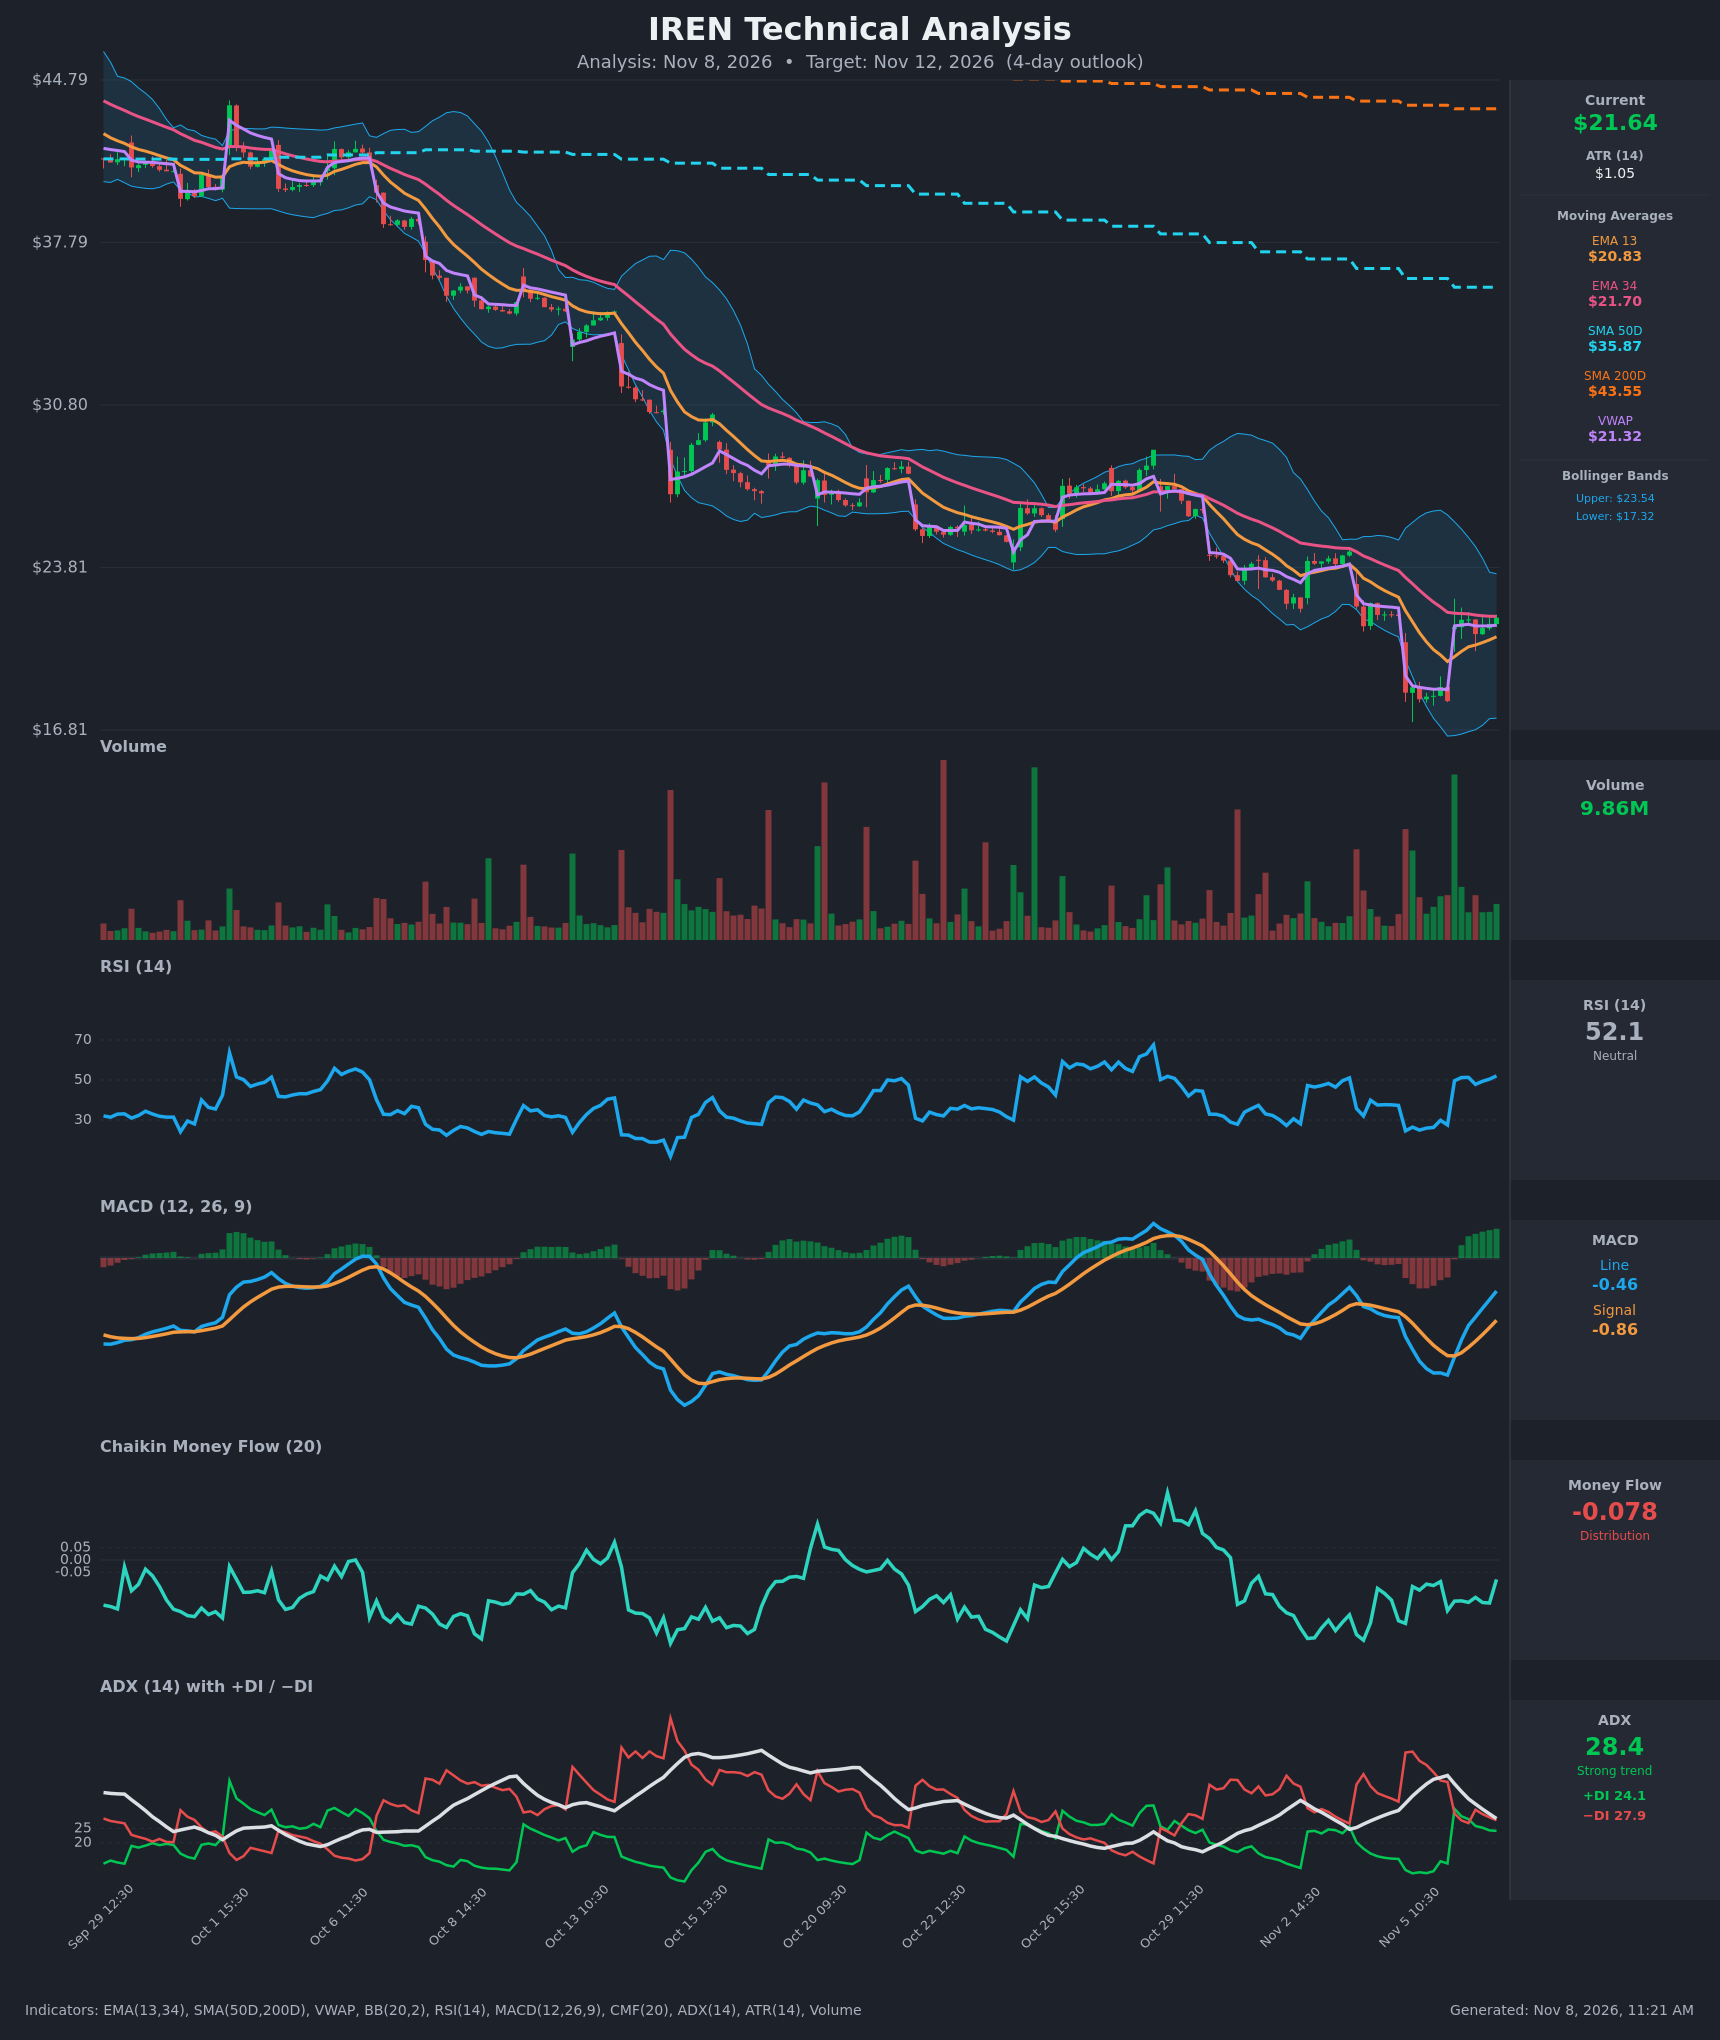
Analysis
TECHNICAL INDICATORS
- RSI (14): 52.06, back to neutral after a washout to about 25 on Nov 5. It has climbed steadily from the oversold reading and has room before 70, but it has not yet cleared the 55-60 zone that would confirm a trend change. [Bullish]
- 20 EMA: Not shown, so I use the EMA 13 ($20.83) and EMA 34 ($21.70). Price ($21.645) is above the EMA 13, which is rising and acts as near-term support. It sits just under the EMA 34, which is flattening and acting as immediate resistance. EMA 13 is still below EMA 34, so there is no bullish crossover yet. [Neutral]
- MACD: The line (-0.455) crossed above the signal (-0.859) on Nov 6 09:30. The histogram is positive at about +0.40 and has widened for 6 straight bars. Both lines are still below zero, so this is a relief rally inside a larger downtrend rather than a confirmed trend reversal. [Bullish]
- Bollinger Bands (20): The bands run from $17.32 to $23.54, with the midline near $20.43. Price is in the upper half of the bands, after bouncing from a lower-band tag around $18. The bands are wide and starting to contract after the volatility spike. Upper-band room is about $1.90, so there is some upside before resistance. [Neutral]
- CMF (20): -0.078, below -0.05, so mild distribution. It has improved from -0.17, but it is still negative, so the bounce lacks strong buying support. [Distribution]
- ADX (14): 28.4 and falling from 43.5. −DI (27.9) is still above +DI (24.1), but the gap has narrowed sharply from 51.5 vs 9.3. The downtrend is still technically strong, but its momentum is fading quickly. [Strong Trend, Bearish but weakening]
- Volume: 9.86M, with an earlier spike on the Nov 6 gap-up bar. Volume during the post-gap consolidation is moderate and green-dominated. Buyers are present, but volume is not expanding to confirm a breakout. [Neutral to mildly Bullish]
DIVERGENCES & TRENDS
- Momentum recovery: RSI rose from about 25 to 52 and MACD crossed bullishly. The bounce is momentum-driven, not just a price spike.
- Fading downtrend: ADX is rolling over while the DI spread collapses from about 40 points to about 4. A +DI/−DI bullish crossover is close, and a cross above 28 would add to the bullish case.
- Moving averages: Price is far below the SMA50D ($35.87) and SMA200D ($43.55). The SMA50D is below the SMA200D (a death cross is in place), so the long-term trend remains bearish. Rallies into the EMA 34 and the declining SMAs have a poor history in this move.
- VWAP: Price is just above VWAP ($21.32), a mild positive for intraday buyers.
- CMF: It has not yet crossed back above +0.05, so volume flow does not confirm the price bounce (a mild non-confirmation).
- Price structure: The chart shows a clear sequence of lower highs and lower lows since early October. The $18 low was reclaimed immediately on a gap, a V-shaped rejection, but no higher high has been made yet.
CHART PATTERNS
- V-shaped reversal / gap fill: Price printed a capitulation low near $18 and recovered most of the drop within one session. This resembles the early stage of a Bullish Falling Wedge or Expanding Triangle reversal, but neither is confirmed.
- Tight post-gap consolidation (Bear Flag / Pennant look-alike): Price has stalled at $21-21.7 beneath the EMA 34. It resembles a pennant, and a break either way would set the 4-day direction. A break above about $21.75 projects toward $23.00-23.50 (upper Bollinger Band and the Nov 4 gap area). A break below about $20.80 would target $19.50 and a retest of $18.
- Larger descending channel: The macro structure of lower highs and lows remains intact until price reclaims $23.50 or above.
POTENTIAL SCENARIOS
- Scenario 1: Bullish Relief Rally Continues — The MACD cross, recovering RSI and narrowing DI spread carry price through the EMA 34. Trigger: a close above $21.75 on rising volume, with +DI crossing above −DI. Target: $22.50-23.00, with a possible extension to the upper Bollinger Band near $23.50. Invalidation: a close below $20.80 (EMA 13). (45% probability)
- Scenario 2: Bearish Rejection at EMA 34 — The distribution reading (CMF) and the dominant downtrend cap the bounce, and price rolls over from the EMA 34 area. Trigger: failure at $21.70-22.00 and a break below the EMA 13 at $20.83. Target: $19.80-20.40 (Bollinger midline), with $18.50 as an extended target. Invalidation: a close above $22.50. (35% probability)
- Scenario 3: Neutral Chop — Price keeps consolidating between the EMA 13 and EMA 34 as ADX falls toward 20. Trigger: no break of $20.80 or $22.00. Target: $21.00-21.90. Invalidation: a decisive close outside the range. (20% probability)
PRICE TARGETS
- Target Price: $22.10 (4-day horizon)
- Expected Range: $20.90 to $22.40 (width $1.50, about 6.9% of current price, scaled for a 4-day horizon)
- Key Levels: Support at $20.83 (EMA 13), with a deeper floor near $18.00. Resistance at $23.50 (upper Bollinger Band), with minor resistance at $21.70 (EMA 34).
OVERALL BIAS
OVERALL BIAS: BULLISH - A bullish MACD crossover with a rising histogram, RSI recovering from oversold, price above the EMA 13 and VWAP, and a fading ADX/DI spread favor a modest continuation of the relief rally over 4 days. Conviction is modest because CMF shows distribution and price remains under the EMA 34 and far below the declining SMAs.
This is educational analysis and not financial advice.