MSTR 4-day bearish forecast — Nov 8, 2026
- Bias: Bearish
- Timeframe: 4 days (made Nov 8, 2026, target date Nov 11, 2026)
- Price at analysis: $128.95
- Price target: $126.00
- Expected range: $121.50 – $131.50
- Result: Correct (-6.6%) — closed at $120.50 on Nov 11, 2026; quality score 74/100
Get a free AI analysis of MSTR today
Analysis
TECHNICAL INDICATORS
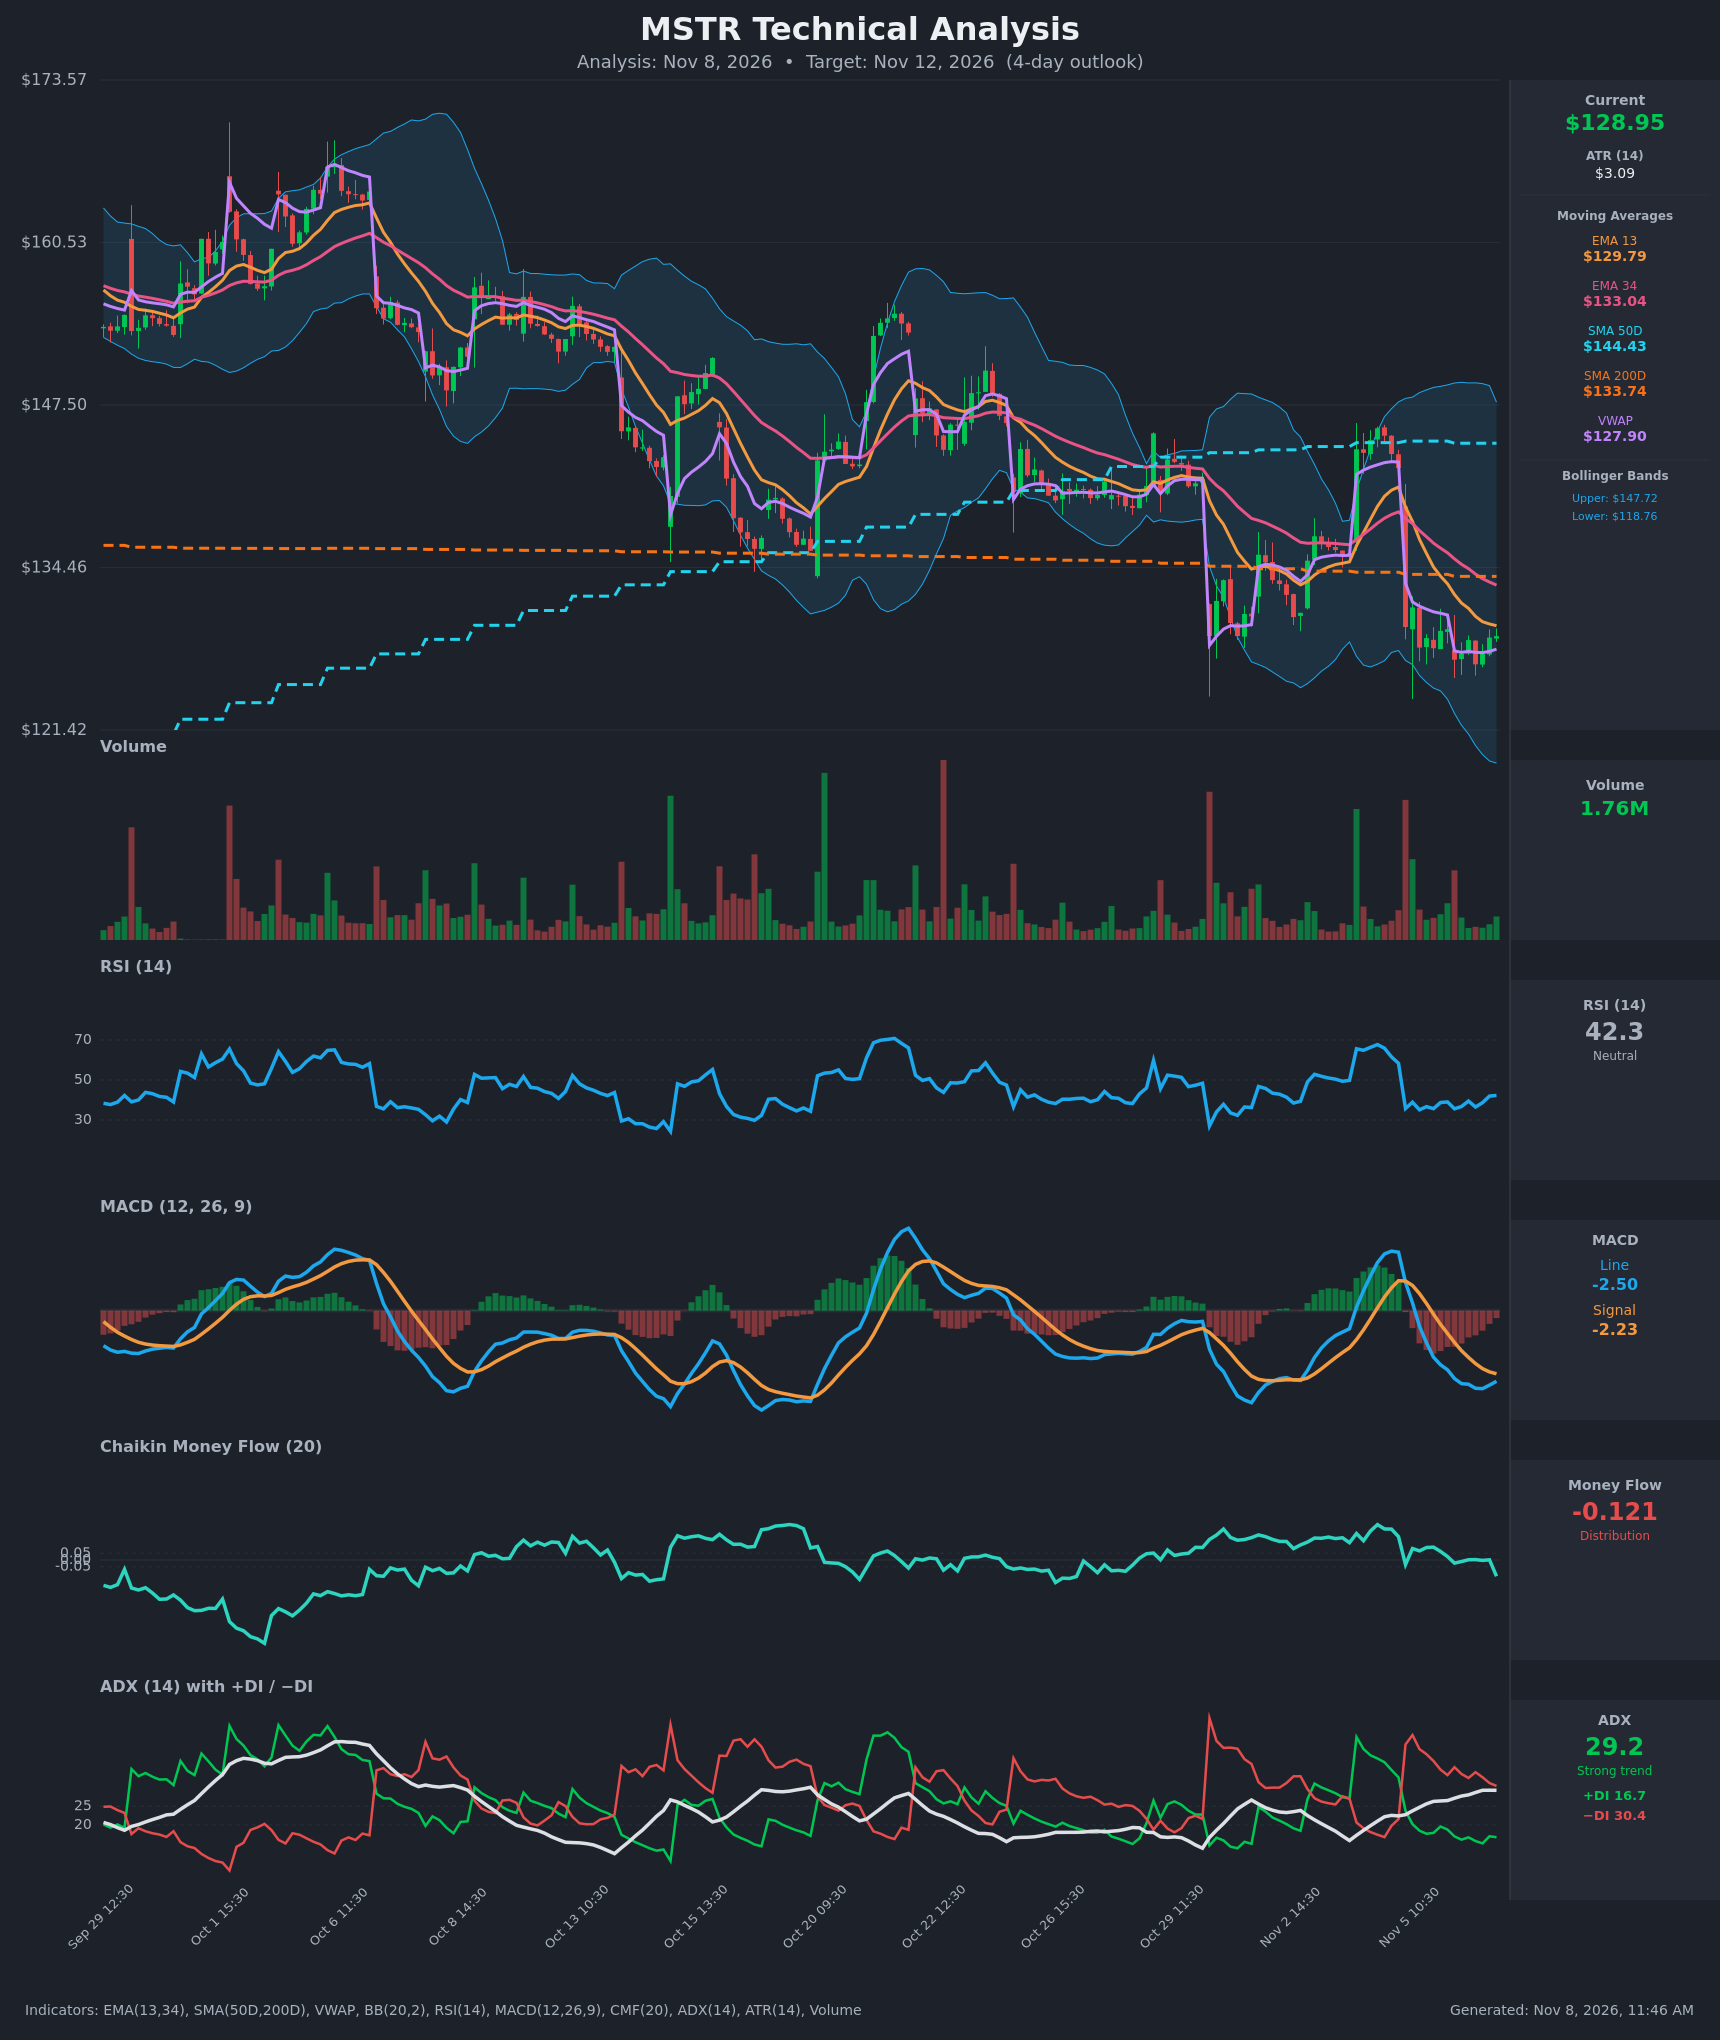
- RSI (14): 42.3, below the 50 midline and recovering from the 35-36 area. It is not oversold, and it has been capped below 50 since the Nov 5 gap down. Momentum is stabilizing but still weak. [Bearish]
- 20 EMA: The chart has no 20 EMA, so I'm using the EMA 13 ($129.79) and EMA 34 ($133.04). Price at $128.95 is below both, and EMA13 is below EMA34 (a bearish cross that happened on Nov 5). Both averages are acting as overhead resistance. [Bearish]
- MACD: Line at -2.50, signal at -2.23, so the line is below the signal with a negative histogram. The line has started to curl up from -2.76 and the histogram is shrinking, a sign of fading downside momentum. There is no bullish cross yet. [Bearish]
- Bollinger Bands (20): Upper $147.72, lower $118.76, midline about $133.2. Price sits in the lower half of the bands, about 1/3 of the way up. The bands are wide after the Nov 5 gap, and there is no squeeze. Price is below the midline, which is bearish but not stretched. [Bearish]
- CMF (20): -0.121, a fresh drop below the -0.05 threshold after hovering near zero. Selling pressure is rising. [Distribution]
- ADX (14): 29.2, rising, with -DI (30.4) well above +DI (16.7). This is a strong downtrend, and the DI gap is wide. [Strong Trend - Bearish]
- Volume: 1.76M on the latest bar, which is moderate and in line with the recent average. The large volume spikes came on the Nov 5 gap-down sell-off. The consolidation since then is on declining volume, so there is no buying surge. [Neutral-to-Bearish]
DIVERGENCES & TRENDS
- A mild bullish divergence in the MACD is forming: the line has been curling up and the histogram contracting while price made roughly equal lows ($126.69 to $127.5). Momentum is slowing, but no cross has occurred.
- Price is below VWAP's anchor of $127.90 only marginally. It is just above VWAP at $128.95, a small short-term support.
- EMA13 is below EMA34, and both are below the SMA50D ($144.43). Price is also below the SMA200D ($133.74), which confirms a long-term downtrend. The SMA50D is still above the SMA200D, so there has been no death cross, but the gap is narrowing.
- CMF dropped from about 0 to -0.12 in the final bar, which is a bearish turn.
- The ADX is rising with -DI dominant, so the trend is intact.
- After the Nov 5 gap down from $142 to $129, price has moved sideways in a tight $126.7-$131.3 band for roughly 2 days.
CHART PATTERNS
- Bearish Pennant / Flag (continuation): After the sharp sell-off from $142 to $129, price formed a tight consolidation at $126.7-$131.3 with lower highs. This resembles the Bearish Flag/Pennant in the reference diagram. A break below $126.5 would project a measured move toward $118-$120, which is also near the lower Bollinger Band.
- Breakdown from the SMA200D: Price failed to recover the SMA200D (~$133.7) and is rejected at the declining EMAs.
- A bullish alternative would be a base near $127. It needs a close above $131.3 and the EMA34 ($133) to be valid.
POTENTIAL SCENARIOS
- Scenario 1: Bearish Pennant Breakdown — Price fails at the EMA13 (~$129.8) and breaks below the $126.7 consolidation low, with -DI dominant and CMF negative continuing the downtrend. Trigger: close below $126.50 on rising volume. Target: $121-$122, with an extension toward the lower band at $118.76. Invalidation: close above $133.0 (EMA34). (50% probability)
- Scenario 2: Neutral Range Chop — Price keeps oscillating between $126.7 support and $131.3 resistance as the MACD flattens and RSI stays 38-48. Trigger: no break of either boundary. Target: $127-$131. Invalidation: close outside the $126.5-$132 range. (25% probability)
- Scenario 3: Bullish Relief Bounce — The MACD histogram's contraction leads to a bullish cross and price reclaims the EMA13/EMA34 zone. Trigger: close above $131.3, then $133. Target: $134-$136 (SMA200D and the Bollinger midline). Invalidation: drop below $126.5. (25% probability)
PRICE TARGETS
- Target Price: $126.00 (4-day horizon, about 2.3% below current; consistent with a bearish tilt of roughly 0.9 ATR per day)
- Expected Range: $121.50 to $131.50 (width $10.00, about 7.8% of current price, in line with the 7-10 day guidance scaled down for 4 days; it is wider than a 2-3 day range)
- Key Levels: Support at $126.50 (consolidation low), then $121.00; Resistance at $131.30 (consolidation high), then $133.74 (SMA200D)
OVERALL BIAS
OVERALL BIAS: BEARISH - A strong downtrend (ADX 29.2, -DI 30.4 vs +DI 16.7), price below all key moving averages, a MACD below its signal line, and CMF dropping into distribution all favor a break lower out of the post-gap bear-flag consolidation. The fading MACD momentum limits conviction, so the move may be modest.
This is educational analysis and not financial advice.