PFE 4-day bearish forecast — Nov 8, 2026
- Bias: Bearish
- Timeframe: 4 days (made Nov 8, 2026, target date Nov 11, 2026)
- Price at analysis: $29.39
- Price target: $29.10
- Expected range: $28.55 – $29.85
- Result: Correct (+0.2%) — closed at $29.45 on Nov 11, 2026; quality score 100/100
Get a free AI analysis of PFE today
Analysis
TECHNICAL INDICATORS
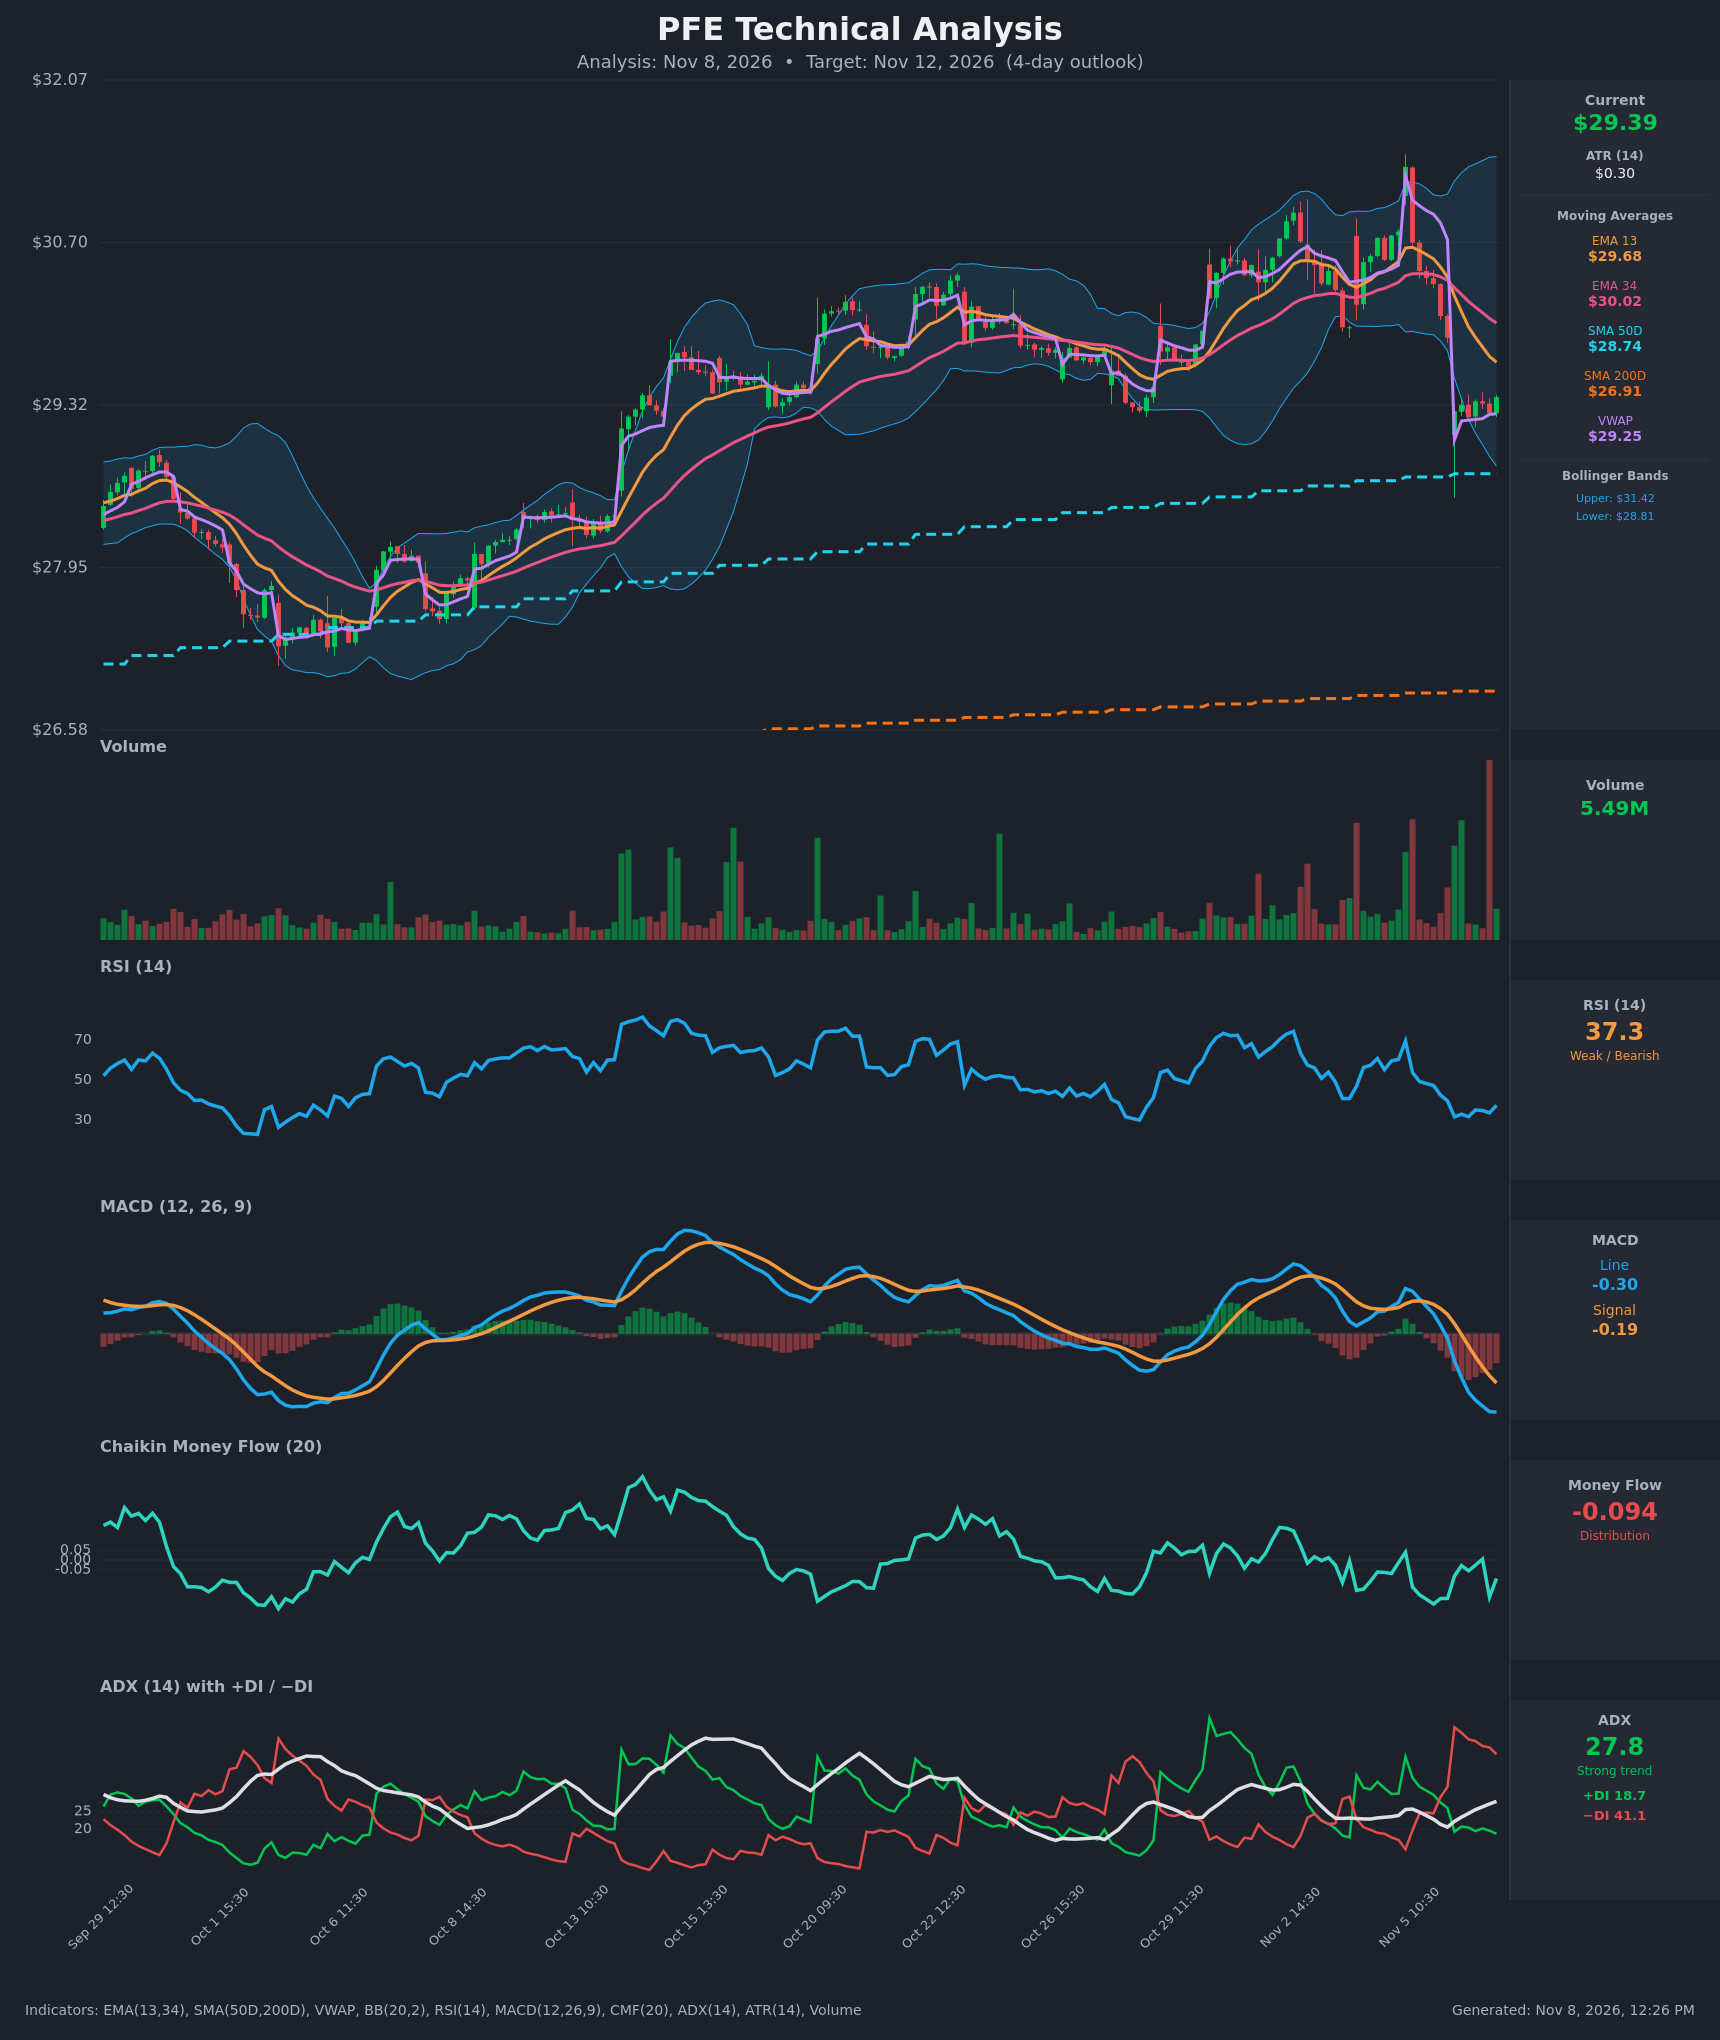
- RSI (14): 37.32, up slightly from the 31.6 low on Nov 6 but still in bearish territory below 40 and near oversold. The bounce is shallow, so momentum is weak with only a tentative stabilization. [Bearish]
- 20 EMA: The data gives EMA 13 at $29.68 and EMA 34 at $30.02, with price at $29.39 below both. EMA 13 crossed below EMA 34 on Nov 6 and the gap is widening, so both averages act as overhead resistance. [Bearish]
- MACD: Line -0.303 is below signal -0.190, with a negative and expanding histogram. The bearish crossover happened around Nov 6 10:30 and both lines are below zero and still falling. [Bearish]
- Bollinger Bands (20): Upper $31.42, lower $28.81. Price sits in the lower third of the bands, about $0.58 above the lower band. The bands are wide after the gap-down volatility, and a lower-band test is possible without a full breakdown. [Bearish]
- CMF (20): -0.094, below the -0.05 threshold and oscillating in negative territory. It shows persistent distribution, with no sign of accumulation after the gap. [Distribution]
- ADX (14): 27.8 and rising (from 20.6), with −DI 41.1 far above +DI 18.7. This is a strong downtrend with bears firmly in control. [Strong Trend – Bearish]
- Volume: 5.49M on the latest bar, after very heavy volume on the Nov 6 gap-down and several heavy red bars on the Nov 5 reversal. The heavy selling shows institutional distribution. Since the gap, volume has faded on the sideways drift, suggesting stabilization rather than a reversal. [Distribution, bearish bias]
- VWAP / SMAs (supplementary): Price is slightly above VWAP ($29.25), which is minor short-term support. It is above SMA50 ($28.74) and SMA200 ($26.91), so the long-term uptrend is intact (no death cross), but the short-term trend has turned down. [Neutral]
DIVERGENCES & TRENDS
- No bullish RSI or MACD divergence yet. RSI made a higher low (about 31 vs 31.6 in the last two dips) but price has made lower highs, so this is not a confirmed divergence.
- The rally to $31.34 on Nov 5 was rejected hard. RSI reached 69 and then collapsed to 31 within a day. This is a classic exhaustion and reversal.
- EMA 13 crossed below EMA 34 around Nov 5 15:30–Nov 6, and the MACD bearish crossover followed. Both cross-based signals are active.
- ADX rose from about 20 to 27.8 while −DI expanded, which confirms the new downtrend rather than a range.
- The gap-down from about $29.89 to $29.27 on Nov 6 has not been filled. Price has since been drifting sideways in a narrow $29.22–$29.39 band.
CHART PATTERNS
- Bearish Double Top (approximate): The Oct 29–Nov 5 highs near $30.7–$31.3 were rejected twice. The neckline near $29.3 has effectively been broken by the gap. The measured move is roughly $1.5–$2.0 below the neckline, toward $27.5–$28, which is beyond this 4-day window. The SMA50 at $28.74 is the first major hurdle.
- Bearish Flag/Pennant (tentative): The tight consolidation just under the gap, at $29.22–$29.39, resembles a small bear flag or pennant. A break below $29.20 would confirm it, with a near-term target around $28.80, the lower Bollinger Band and the SMA50.
- Overall structure: a short-term reversal inside a larger intact uptrend (price above SMA50 and SMA200), so the downside is likely to be contained near $28.7.
POTENTIAL SCENARIOS
- Scenario 1: Bearish Flag Breakdown — Price fails to reclaim EMA 13, and the post-gap consolidation breaks lower with −DI dominance and negative CMF. Sellers push toward the lower Bollinger Band and SMA50 zone. Trigger: hourly close below $29.20 (VWAP and the consolidation low). Target: $28.80–$28.95. Invalidation: close above $29.70 (EMA 13). (50% probability)
- Scenario 2: Neutral Consolidation Above Support — Price chops sideways between VWAP and EMA 13 as the oversold RSI limits downside and the downtrend limits upside. Trigger: price stays within $29.15–$29.65. Target: $29.30–$29.45. Invalidation: a break outside $29.00–$29.75. (20% probability)
- Scenario 3: Bullish Relief Bounce / Gap Fill — An oversold bounce (RSI near 37) lifts price to partially fill the Nov 6 gap. Trigger: hourly close above $29.70 with CMF turning positive. Target: $29.90–$30.00 (the gap area and EMA 34). Invalidation: close back below $29.25. (30% probability)
PRICE TARGETS
Range check for a 4-day timeframe: width is $29.85 − $28.55 = $1.30, or 4.4% of $29.39, within the ~3–5% guidance (wider than a 2–3 day range).
- Target Price: $29.10 (4 trading days out, about Nov 12)
- Expected Range: $28.55 to $29.85
- Key Levels: Support at $28.74 (SMA50 and just below the lower Bollinger Band at $28.81), Resistance at $29.68 (EMA 13)
OVERALL BIAS
OVERALL BIAS: BEARISH - ADX is rising at 27.8 with −DI (41.1) far above +DI (18.7), MACD is below its signal and falling, price is below EMA 13 and EMA 34, and CMF shows persistent distribution after a heavy-volume gap-down. Downside is likely limited by the oversold-leaning RSI and the SMA50 near $28.74.
This is educational analysis and not financial advice.