PFE 6-day bearish forecast — Nov 8, 2026
- Bias: Bearish
- Timeframe: 6 days (made Nov 8, 2026, target date Nov 13, 2026)
- Price at analysis: $29.39
- Price target: $29.05
- Expected range: $28.25 – $29.90
- Result: Correct (-1.7%) — closed at $28.89 on Nov 13, 2026; quality score 100/100
Get a free AI analysis of PFE today
Analysis
TECHNICAL INDICATORS
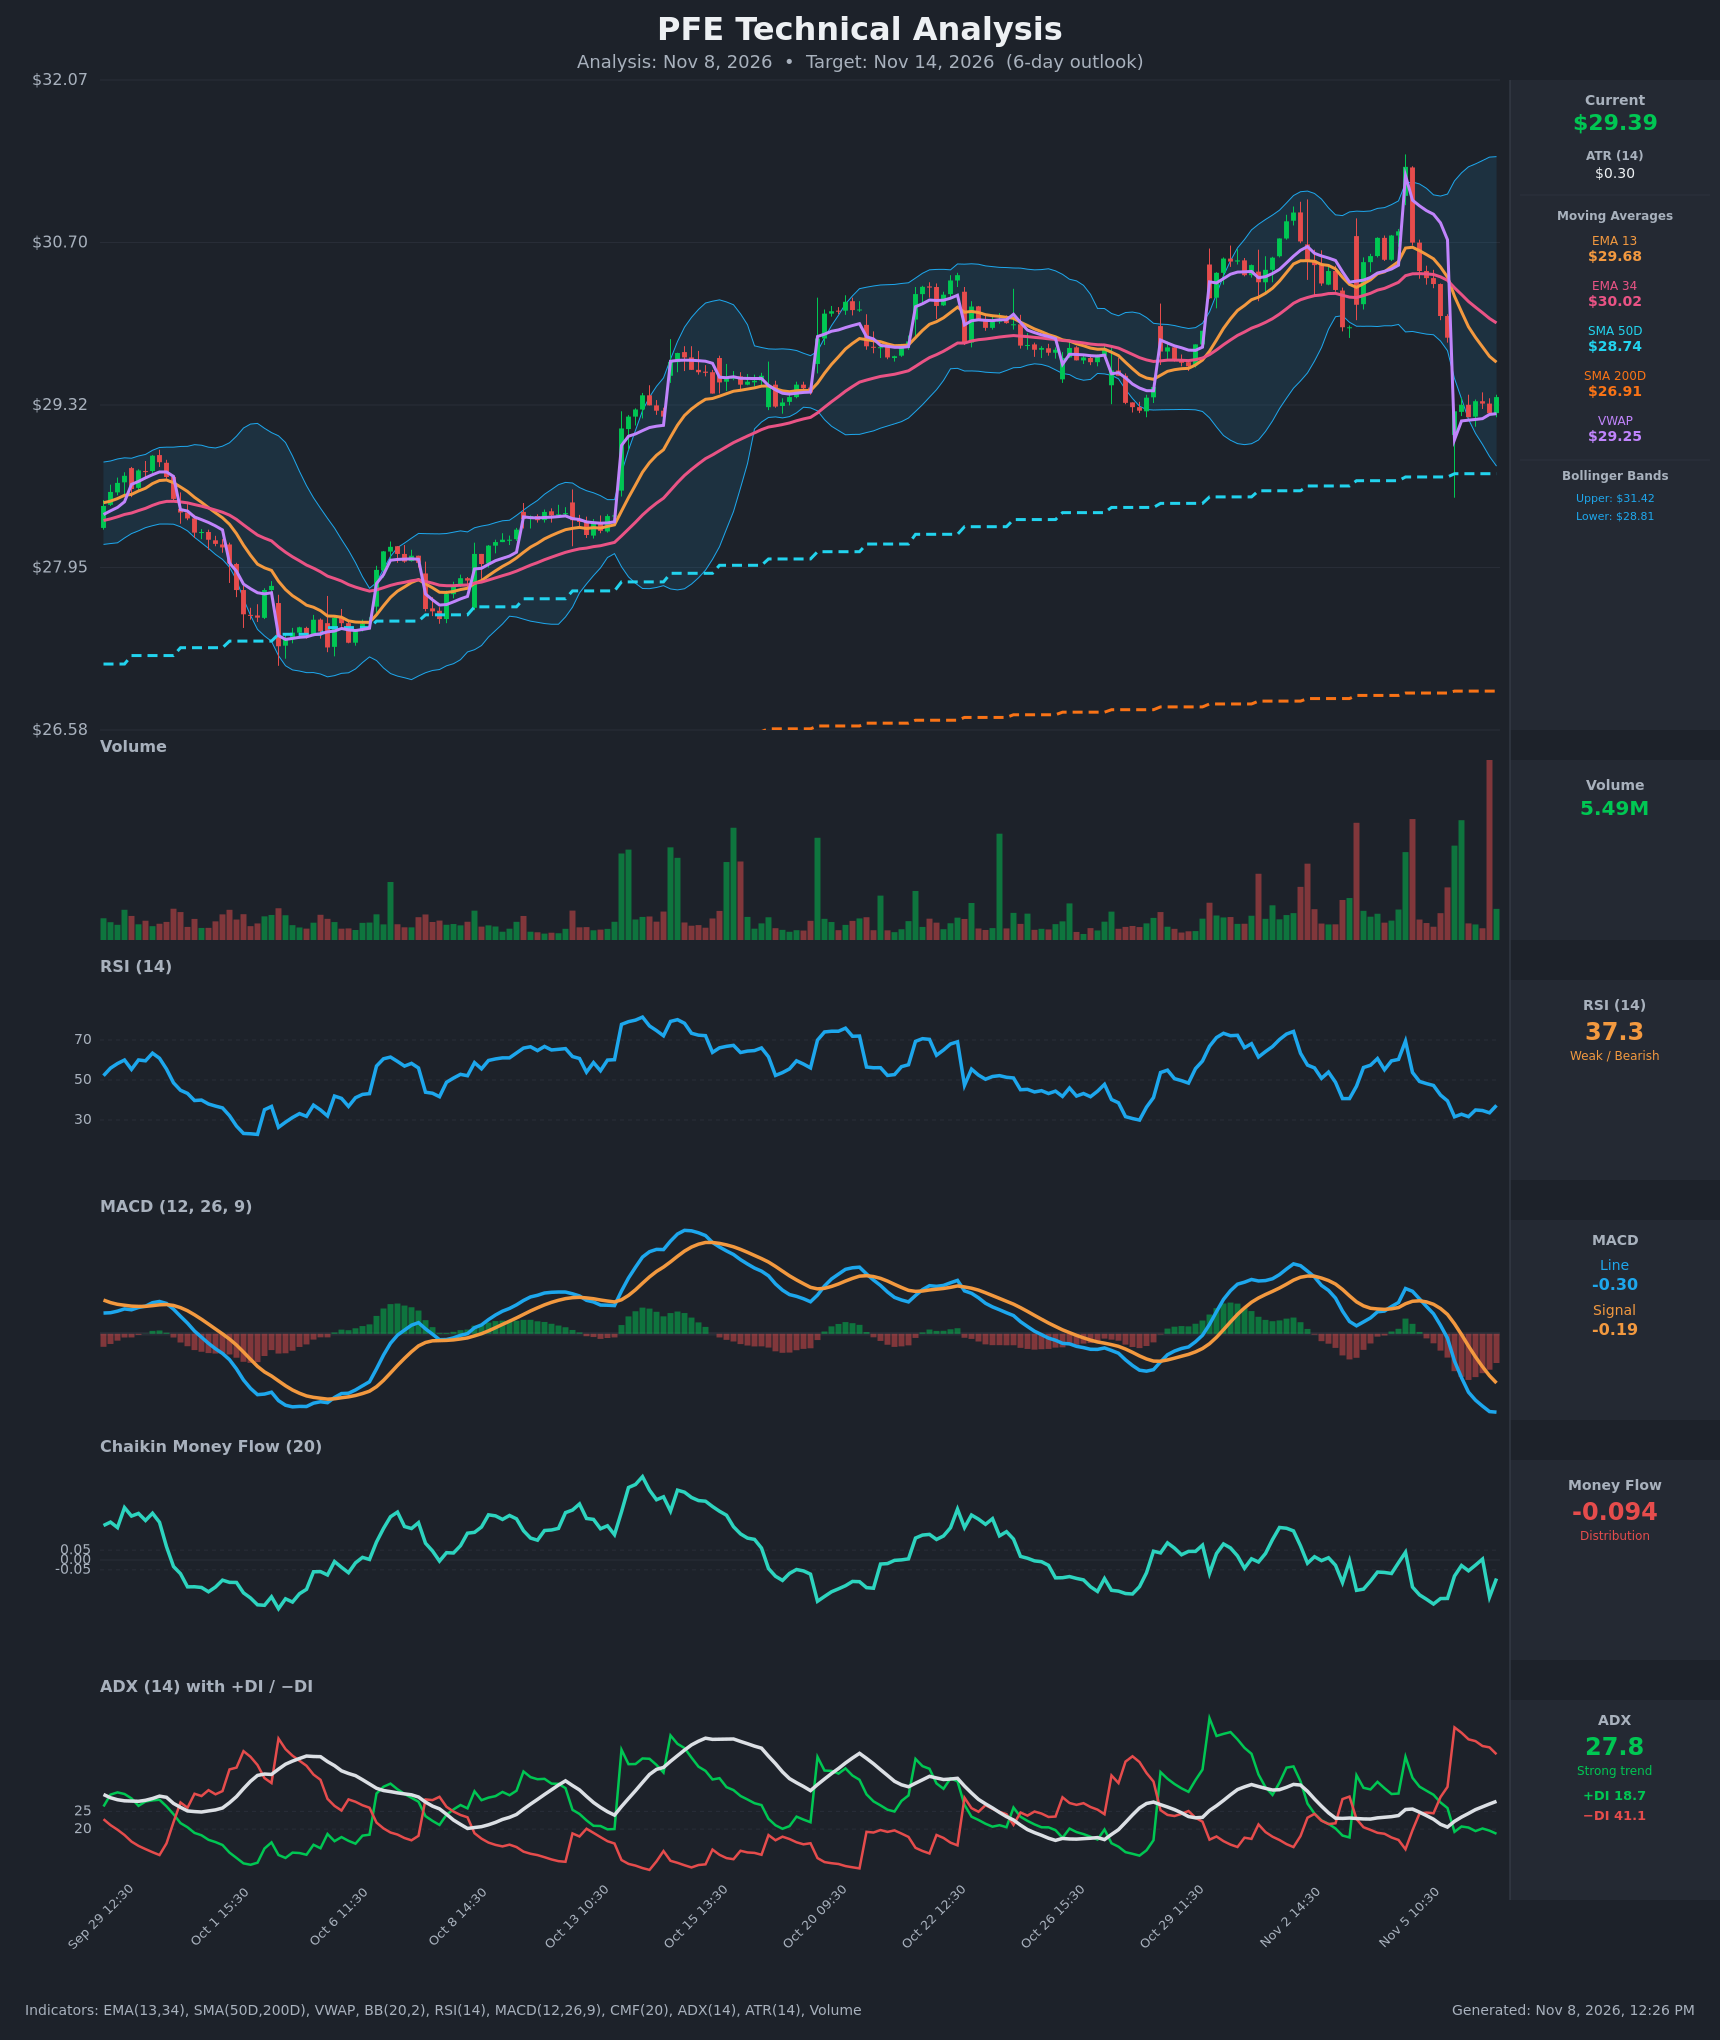
- RSI (14): 37.32, recovering slightly from 31.6 on the Nov 6 open but still below 50 and near oversold. It has rolled over from 69 on Nov 5, so momentum is bearish, though not yet an extreme that forces a bounce. [Bearish]
- 20 EMA: The supplied EMAs are EMA 13 at $29.68 and EMA 34 at $30.02. Price at $29.39 is below both. EMA 13 crossed below EMA 34 on Nov 6 (about 09:30–10:30), a fresh bearish cross, and both now act as overhead resistance. [Bearish]
- MACD: Line at -0.303, signal at -0.190, so the histogram is about -0.113. The line crossed below the signal on Nov 5 (15:30) and has kept diverging lower. It is below zero and the histogram is widening, so downside momentum is still expanding. [Bearish]
- Bollinger Bands (20): Upper $31.42, lower $28.81, midline about $30.11. Price sits in the lower third after a sharp gap-down out of the upper half of the bands. The bands are wide, so volatility is elevated. There is room to the lower band (about $0.58 below) but no outright oversold signal. [Bearish]
- CMF (20): -0.094, below the -0.05 threshold. It has been mostly negative since the Nov 5 reversal, with only a brief tick to about 0 on Nov 6 13:30, so distribution is dominant. [Distribution]
- ADX (14): 27.8 and rising (from 20.6 on Nov 5), with −DI at 41.1 versus +DI at 18.7. Bears are firmly in control, and the −DI/+DI spread of more than 22 points shows one-sided trend pressure. [Strong Trend – Bearish]
- Volume: 5.49M. The chart shows a heavy volume spike on the gap-down bars (red) and the heaviest bar at the far right. Recent bars have been lighter with a small green close, which hints at stabilization but not accumulation. [Bearish on the breakdown, with early stabilization]
- Other levels: Price is above VWAP ($29.25), SMA50D ($28.74) and SMA200D ($26.91). The long-term trend is up, and the SMA50 is a strong support shelf just below.
DIVERGENCES & TRENDS
- No bullish RSI or MACD divergence. RSI made a higher low (about 31.6 versus 30 earlier), but MACD and CMF are both making lower lows with price, so momentum confirms the decline.
- The trend flipped quickly from bullish (Nov 5, RSI 69, +DI 40) to bearish (Nov 6, −DI 48) within one session. Such a sharp gap reversal on heavy volume is usually followed by a lower-high retest rather than an immediate V-bounce.
- Crossovers: EMA13 crossed below EMA34, MACD crossed below its signal, and −DI crossed above +DI (Nov 5 afternoon). All three are bearish.
- Price has been holding $29.2–$29.4 for several hourly bars, just above VWAP. That stalling is the main near-term counterpoint, and it could resolve either way.
- The SMA50 and SMA200 are both rising, with price above both. There is no death cross, so the larger uptrend is intact and a pullback toward the SMA50 would be a normal retracement.
CHART PATTERNS
- Bearish Flag / Pennant (tentative): After the sharp gap-down pole from about $30.4 to $29.2, price is consolidating in a tight $29.2–$29.4 range. A break below $29.20 would project a measured move of about $1.0–1.2 toward $28.0–28.2. The SMA50 ($28.74) and the lower Bollinger Band ($28.81) are likely to slow the move before that.
- Bearish Double Top (loose): Highs of about $30.9 and $31.3 in the Oct 29–Nov 5 area, followed by a break of the neckline around $30.0–30.4. This supports a lower-high structure, and the gap-down confirms it.
- The gap itself ($29.9 to $29.3) acts as resistance, and a retest of $29.7–$30.0 is a likely rejection zone.
POTENTIAL SCENARIOS
- Scenario 1: Bearish Flag Breakdown to SMA50 — Price fails to reclaim the EMA13 and breaks the $29.20 base, with −DI dominance and negative MACD keeping pressure on. Trigger: hourly close below $29.20 (VWAP about $29.25). Target: $28.75–$29.00, where the SMA50 and lower Bollinger Band converge. Invalidation: a close above $29.70 (EMA13). (50% probability)
- Scenario 2: Bullish Relief Bounce / Gap Fill Attempt — RSI near 31–37 and the SMA50 support attract dip buyers, and price retraces into the gap. Trigger: break and hold above $29.70. Target: $29.90–$30.02 (EMA34 and the gap). Invalidation: a rejection at $29.7–$30.0 and a close back under $29.20. (30% probability)
- Scenario 3: Neutral Consolidation — Price chops between $29.00 and $29.70 as the volatility spike cools. Trigger: ADX stalls and the MACD histogram flattens. Target: about $29.30–$29.40. Invalidation: a close outside the $28.9–$29.8 band. (20% probability)
PRICE TARGETS
- Target Price: $29.05 (by Nov 14, 6-day horizon)
- Expected Range: $28.25 to $29.90 (width $1.65 ≈ 5.6% of the current price, consistent with the ~4–8% guidance for a 6-day timeframe; about 5× the daily ATR of $0.30)
- Key Levels: Support at $28.74 (SMA50D), Resistance at $29.68 (EMA 13)
OVERALL BIAS
OVERALL BIAS: BEARISH - Fresh EMA13/34 and MACD bearish crosses, −DI far above +DI with ADX rising above 25, and negative CMF all favor further downside. The likely path is a drift toward the SMA50 and lower Bollinger Band near $28.75–$29.00, with the SMA50 limiting any deeper decline.
This is educational analysis and not financial advice.