NIO 4-day bullish forecast — Nov 8, 2026
- Bias: Bullish
- Timeframe: 4 days (made Nov 8, 2026, target date Nov 11, 2026)
- Price at analysis: $3.40
- Price target: $3.43
- Expected range: $3.30 – $3.47
- Result: Incorrect (-5.2%) — closed at $3.22 on Nov 11, 2026; quality score 0/100
Get a free AI analysis of NIO today
Analysis
TECHNICAL INDICATORS
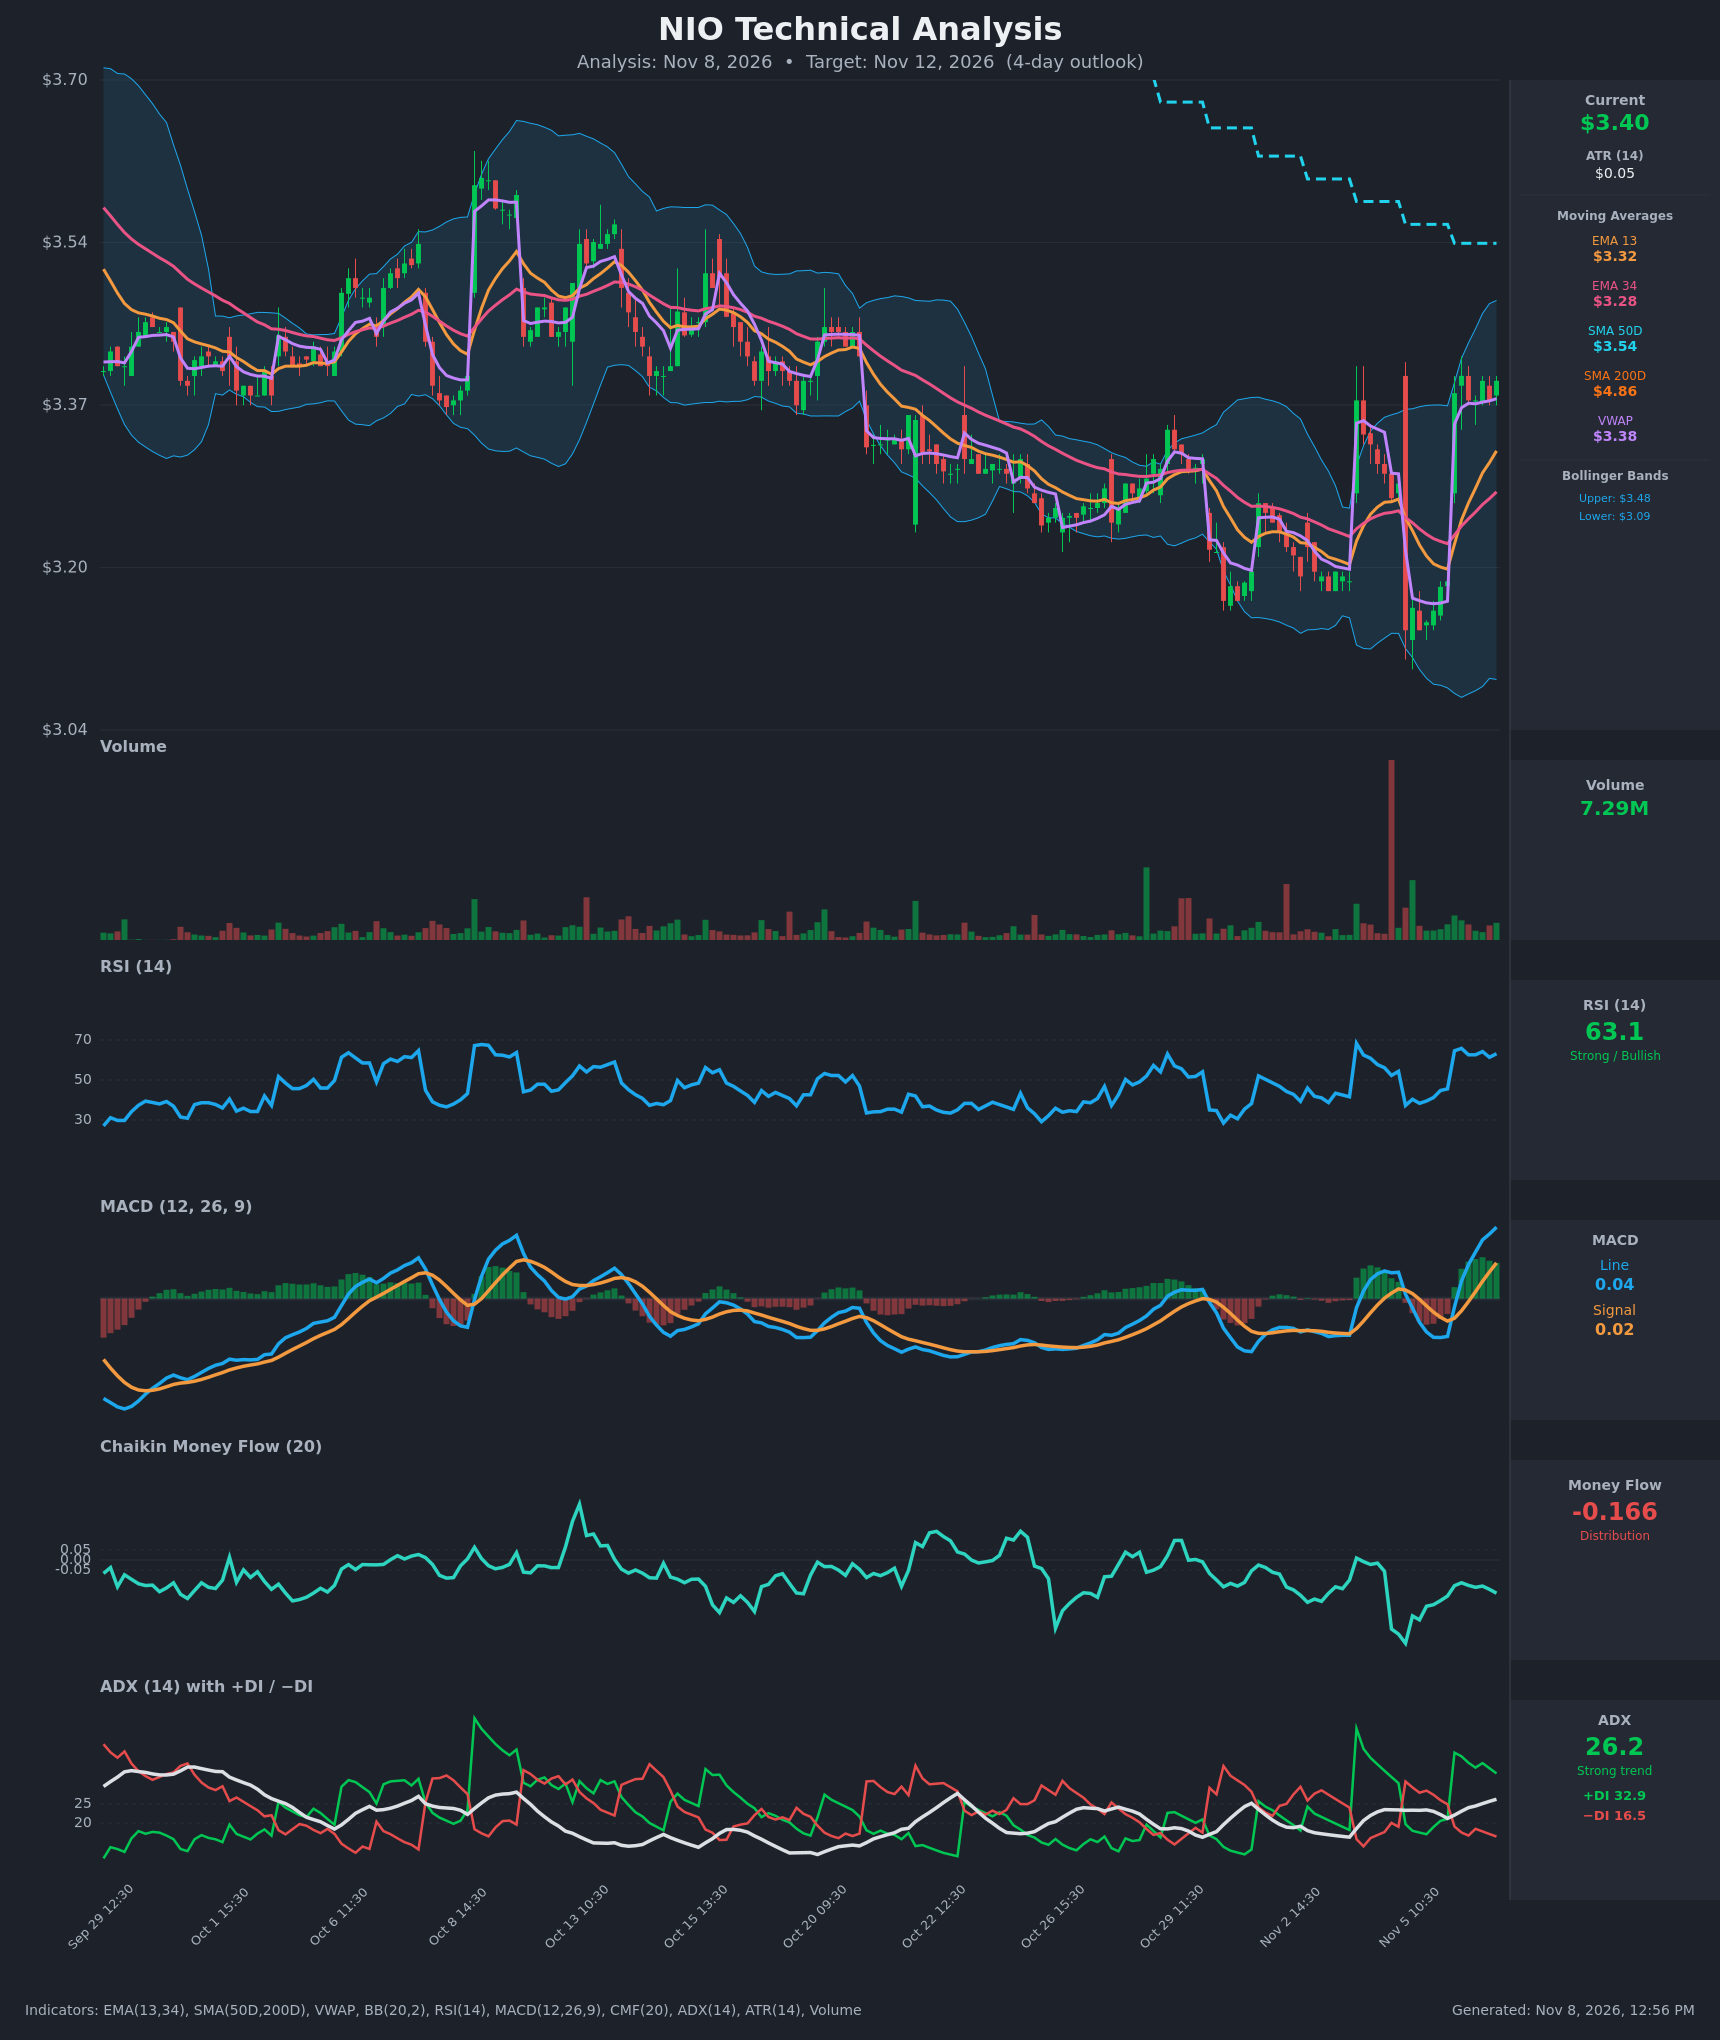
- RSI (14): 63.12, up from 37-45 on Nov 5 after the Nov 6 gap-up. It is in the bullish zone but below 70, so there is room to run. Momentum has flattened at 62-65 over the last several bars. [Bullish]
- 20 EMA: The data gives EMA 13 at $3.3234 and EMA 34 at $3.2815, which I use as the short-term proxy. Price ($3.395) is above both. EMA13 crossed above EMA34 around Nov 6 11:30 and the gap is widening, so both act as dynamic support. [Bullish]
- MACD: Line 0.0387 vs signal 0.0193, with a positive and expanding histogram. The bullish crossover came on Nov 6 around 10:30, and the line has risen every bar since. It is still well below the Oct 8 peak. [Bullish]
- Bollinger Bands (20): Upper $3.4771, lower $3.0897, midline about $3.28. Price is in the upper half of the bands, about $0.08 (roughly 1.5 ATR) below the upper band. The bands are wide after the volatility spike, so a breakout is possible but the upper band is the first hurdle. [Bullish]
- CMF (20): -0.166, well below -0.05, and it has stayed negative throughout the bounce. Rallying price on persistent distribution means the move lacks buying-pressure confirmation. [Distribution]
- ADX (14): 26.2 and rising, with +DI (32.9) well above −DI (16.5). The +DI/−DI bullish crossover came on Nov 6 at the open, and the trend is now strong and bullish in the short term. [Strong Trend, Bullish]
- Volume: 7.29M, moderate and in line with recent bars. The largest volume spike on the chart was a red capitulation bar on Nov 5, followed by an upward gap on average volume. Volume is not confirming the move with any real surge. [Neutral / Mildly Supportive]
DIVERGENCES & TRENDS
- CMF vs price: Price has bounced from about $3.12 to $3.40, but CMF stays deeply negative at -0.166. This is a non-confirmation (bearish divergence) and the main caution against chasing the move.
- Short-term trend: The indicator picture has flipped bullish. The EMA13/EMA34 bullish cross, MACD signal-line cross and +DI/−DI cross all occurred on Nov 6. Price also sits above VWAP ($3.3768), which suggests intraday buyers are in control.
- Long-term trend: Price is below SMA50 ($3.5356) and far below SMA200 ($4.8636). The death cross is long established and the bigger trend remains down. The bounce is a counter-trend move until price reclaims about $3.54.
- Gap behavior: The gap from about $3.19 to $3.38 has held, and price has consolidated at $3.38-$3.40 without filling it. That is constructive.
CHART PATTERNS
- Bullish Falling Wedge / descending channel breakout: The Oct 8 high to Nov 5 low was a series of lower highs and lower lows. The Nov 6 gap pushed price above the channel and the EMAs. A confirmed breakout points to a retest of the $3.48-$3.54 zone, which is the upper Bollinger Band and SMA50.
- Bullish Flag / Pennant (minor): The tight $3.38-$3.40 consolidation after the gap-up is a small continuation structure. A break above $3.40 projects about $3.48-$3.50.
- Caveat: The overhead SMA50 at $3.54 and the CMF distribution reading limit upside, so the targets are modest.
POTENTIAL SCENARIOS
- Scenario 1: Bullish Continuation Toward the Upper Band — Price holds the gap, supported by the EMA13, and breaks the $3.40 consolidation as MACD and +DI stay strong. Trigger: a close above $3.41 with RSI holding above 60. Target: $3.45-$3.50 (upper BB, with SMA50 at $3.54 as a stretch). Invalidation: a close below $3.32 (EMA13). (50% probability)
- Scenario 2: Bearish Pullback / Gap Fill — Negative CMF and the downtrend below SMA50/SMA200 cap the bounce, and price fades back toward the EMAs. Trigger: a rejection at $3.43-$3.48 and a break below $3.32. Target: $3.28-$3.20 (EMA34, then the gap area). Invalidation: a close back above $3.45. (28% probability)
- Scenario 3: Neutral Range Chop — Price consolidates between the EMA13 and the upper band while ADX cools. Trigger: failure to break either $3.32 or $3.48. Target: $3.35-$3.43. Invalidation: a close outside $3.30-$3.48. (22% probability)
PRICE TARGETS
- Target Price: $3.43 (4-day, Nov 12)
- Expected Range: $3.30 to $3.47 (width $0.17, about 5.0% of the current price, which fits the 4-day timeframe and is wider than a 2-3 day range)
- Key Levels: Support at $3.32 (EMA13), Resistance at $3.48 (upper Bollinger Band; the SMA50 at $3.54 is the next level above)
OVERALL BIAS
OVERALL BIAS: BULLISH - EMA, MACD and DI crossovers all turned bullish, ADX is above 25 with +DI dominant, and price is holding the gap above the EMAs and VWAP. Upside is likely capped near $3.48-$3.54 by resistance and by the persistent CMF distribution, so conviction is moderate.
This is educational analysis and not financial advice.