NIO 6-day bullish forecast — Nov 8, 2026
- Bias: Bullish
- Timeframe: 6 days (made Nov 8, 2026, target date Nov 13, 2026)
- Price at analysis: $3.40
- Price target: $3.46
- Expected range: $3.30 – $3.52
- Result: Incorrect (-15.5%) — closed at $2.87 on Nov 13, 2026; quality score 0/100
Get a free AI analysis of NIO today
Analysis
TECHNICAL INDICATORS
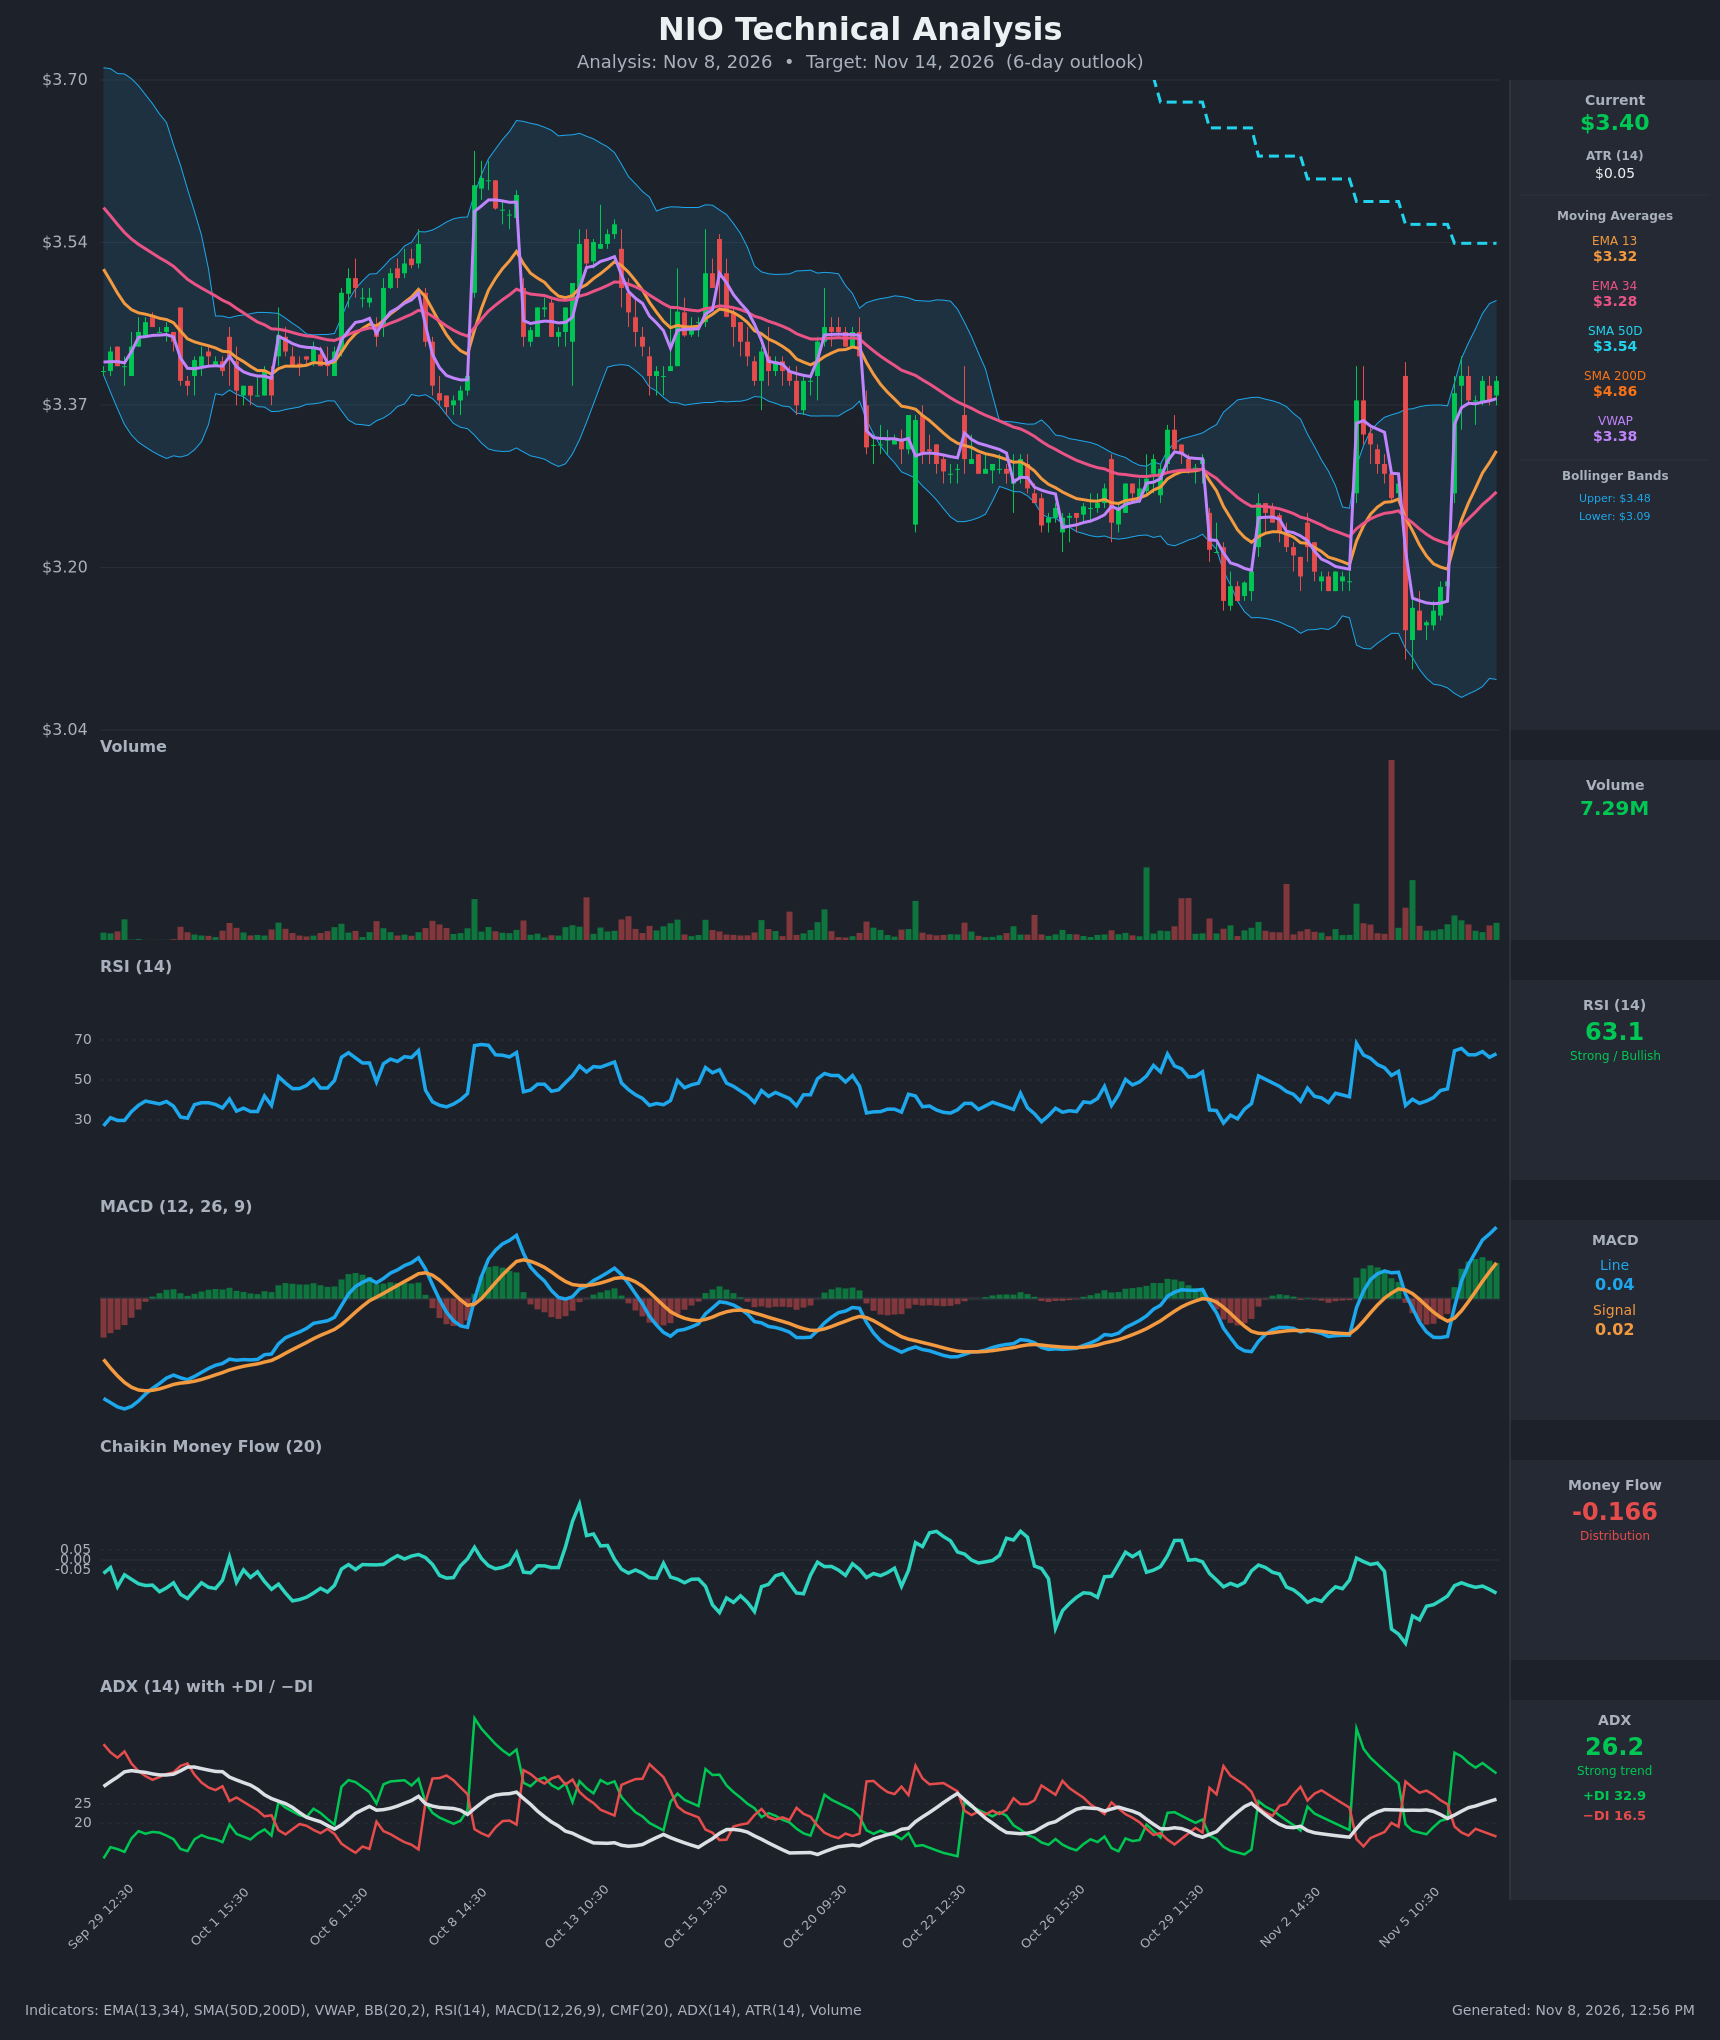
- RSI (14): 63.12, in the upper-neutral/bullish zone and not yet overbought. It rebounded sharply from 37-45 on Nov 5 to the low-to-mid 60s after the Nov 6 gap. It has held at 61-65 for several bars, which shows sustained rather than spiking momentum. [Bullish]
- 20 EMA: The data supplies EMA 13 ($3.3234) and EMA 34 ($3.2815), so I use the 13 as the short-term proxy. Price at $3.395 is above both. EMA13 crossed back above EMA34 on Nov 6, and both are curling upward, so the short-term averages now act as support. [Bullish]
- MACD: Line 0.0387 is above Signal 0.0193 and both are positive. A bullish crossover occurred on Nov 6 around 12:30 and the histogram is expanding (~+0.019). The chart shows the line making a higher high than the prior swing. [Bullish]
- Bollinger Bands (20): Upper $3.4771, lower $3.0897, so the middle is about $3.28. Price at $3.395 sits in the upper half, roughly 78% of the band width. The bands are wide after the volatile gap, which leaves room to run but means the upper band (~$3.48) is near-term resistance. [Bullish]
- CMF (20): -0.166, well below -0.05, so money flow is distribution. It has been negative throughout the recent move, improving from -0.42 but never turning positive. The rally is not confirmed by volume-weighted buying, which is the main caution. [Distribution]
- ADX (14): 26.2 and rising from ~21, so a trend is establishing. +DI (32.9) is far above −DI (16.5), meaning bulls are in control. The DI flip on Nov 6 from bearish to bullish confirms the reversal. [Strong Trend – Bullish]
- Volume: 7.29M, moderate and in line with recent bars. The huge red volume spike near the Nov 5 low looks like capitulation or a washout, followed by green volume bars on the rebound. Volume is not surging on the advance. [Mildly Supportive / Not Confirming]
Other levels:
- VWAP: $3.3768, with price above it, which indicates intraday buying control.
- SMA50D: $3.5356, overhead and falling, which is the main resistance.
- SMA200D: $4.8636, far above price, so the long-term trend is still down.
- Death cross: SMA50 is well below SMA200, a long-standing bearish backdrop.
DIVERGENCES & TRENDS
- Double bottom: Price made a near-equal low at ~$3.11-3.12 (Oct 29 and Nov 5) while RSI made a higher low (~29 to ~37). That is a mild bullish divergence.
- Indicator trends: MACD, RSI and ADX are all turning up together, and the DI crossover and MACD bullish crossover both fired on Nov 6.
- CMF divergence: CMF remains deeply negative while price rebounds, a bearish divergence that warns the bounce may lack follow-through.
- Larger trend: Price is still below the falling SMA50 and far below the SMA200, so this is a counter-trend rebound within a larger downtrend.
- Crossovers and breaks: Price reclaimed EMA13, EMA34 and VWAP, and gapped from $3.19 to $3.38 on Nov 6 before consolidating near $3.38-3.40.
CHART PATTERNS
- Bullish Double Bottom (tentative): Two lows around $3.11-3.12 with a neckline near $3.38-3.40, which price is now testing. The measured move (~$0.27) projects to ~$3.65, beyond a 6-day horizon. A realistic intermediate target is the SMA50 at ~$3.54.
- Bullish Falling Wedge (loose): Since the Oct 8 peak, price has made lower highs and lower lows in a converging channel. The Nov 6 gap and close above the upper trendline resemble a wedge breakout. The wedge's initial target is a retracement toward the SMA50 (~$3.54) and the top of the range.
- Flag-like pause: The tight $3.38-3.40 consolidation after the gap behaves like a small bull flag. A hold above $3.37 keeps the pattern intact.
POTENTIAL SCENARIOS
- Scenario 1: Bullish Breakout Toward the SMA50 — The double-bottom neckline and the Nov 6 gap hold, and momentum (MACD, ADX, +DI) carries price through the upper Bollinger Band. Trigger: a close above $3.41-3.43 with volume above ~7-8M. Target: $3.48-3.54 (upper BB, then SMA50). Invalidation: a close below $3.32 (EMA13 and gap-fill zone). (50% probability)
- Scenario 2: Neutral Consolidation Under Resistance — Price stalls beneath the upper BB and SMA50 as CMF distribution caps gains. It chops between VWAP and ~$3.48. Trigger: failure to close above $3.45 with fading volume. Target: $3.35-3.45. Invalidation: a close outside $3.30-$3.52. (28% probability)
- Scenario 3: Bearish Failed Rally and Gap Fill — Persistent distribution (CMF -0.17) and the falling SMA50/SMA200 trend reassert, and the bounce fails as a lower high. Trigger: a loss of VWAP ($3.377) and EMA13 ($3.32). Target: $3.19-3.25 (gap origin). Invalidation: a close above $3.48. (22% probability)
PRICE TARGETS
- Target Price: $3.46 (6-day horizon, about +1.9% from $3.395)
- Expected Range: $3.30 to $3.52 (width $0.22, about 6.5% of current price, which fits the 6-day guidance of ~4-8%)
- Key Levels: Support at $3.32 (EMA13, with VWAP at ~$3.38 as first support), Resistance at $3.48 (upper Bollinger Band, with the SMA50 at $3.54 above)
OVERALL BIAS
OVERALL BIAS: BULLISH - Price has reclaimed the EMAs and VWAP, MACD and the DIs both crossed bullish, ADX is rising above 25, and a possible double bottom/falling wedge breakout is forming. Conviction is modest because CMF shows persistent distribution and the falling SMA50 (~$3.54) and upper Bollinger Band (~$3.48) cap upside.
This is educational analysis and not financial advice.