MARA 4-day bearish forecast — Nov 8, 2026
- Bias: Bearish
- Timeframe: 4 days (made Nov 8, 2026, target date Nov 11, 2026)
- Price at analysis: $6.34
- Price target: $6.17
- Expected range: $5.82 – $6.60
- Result: Incorrect (+19.6%) — closed at $7.58 on Nov 11, 2026; quality score 0/100
Get a free AI analysis of MARA today
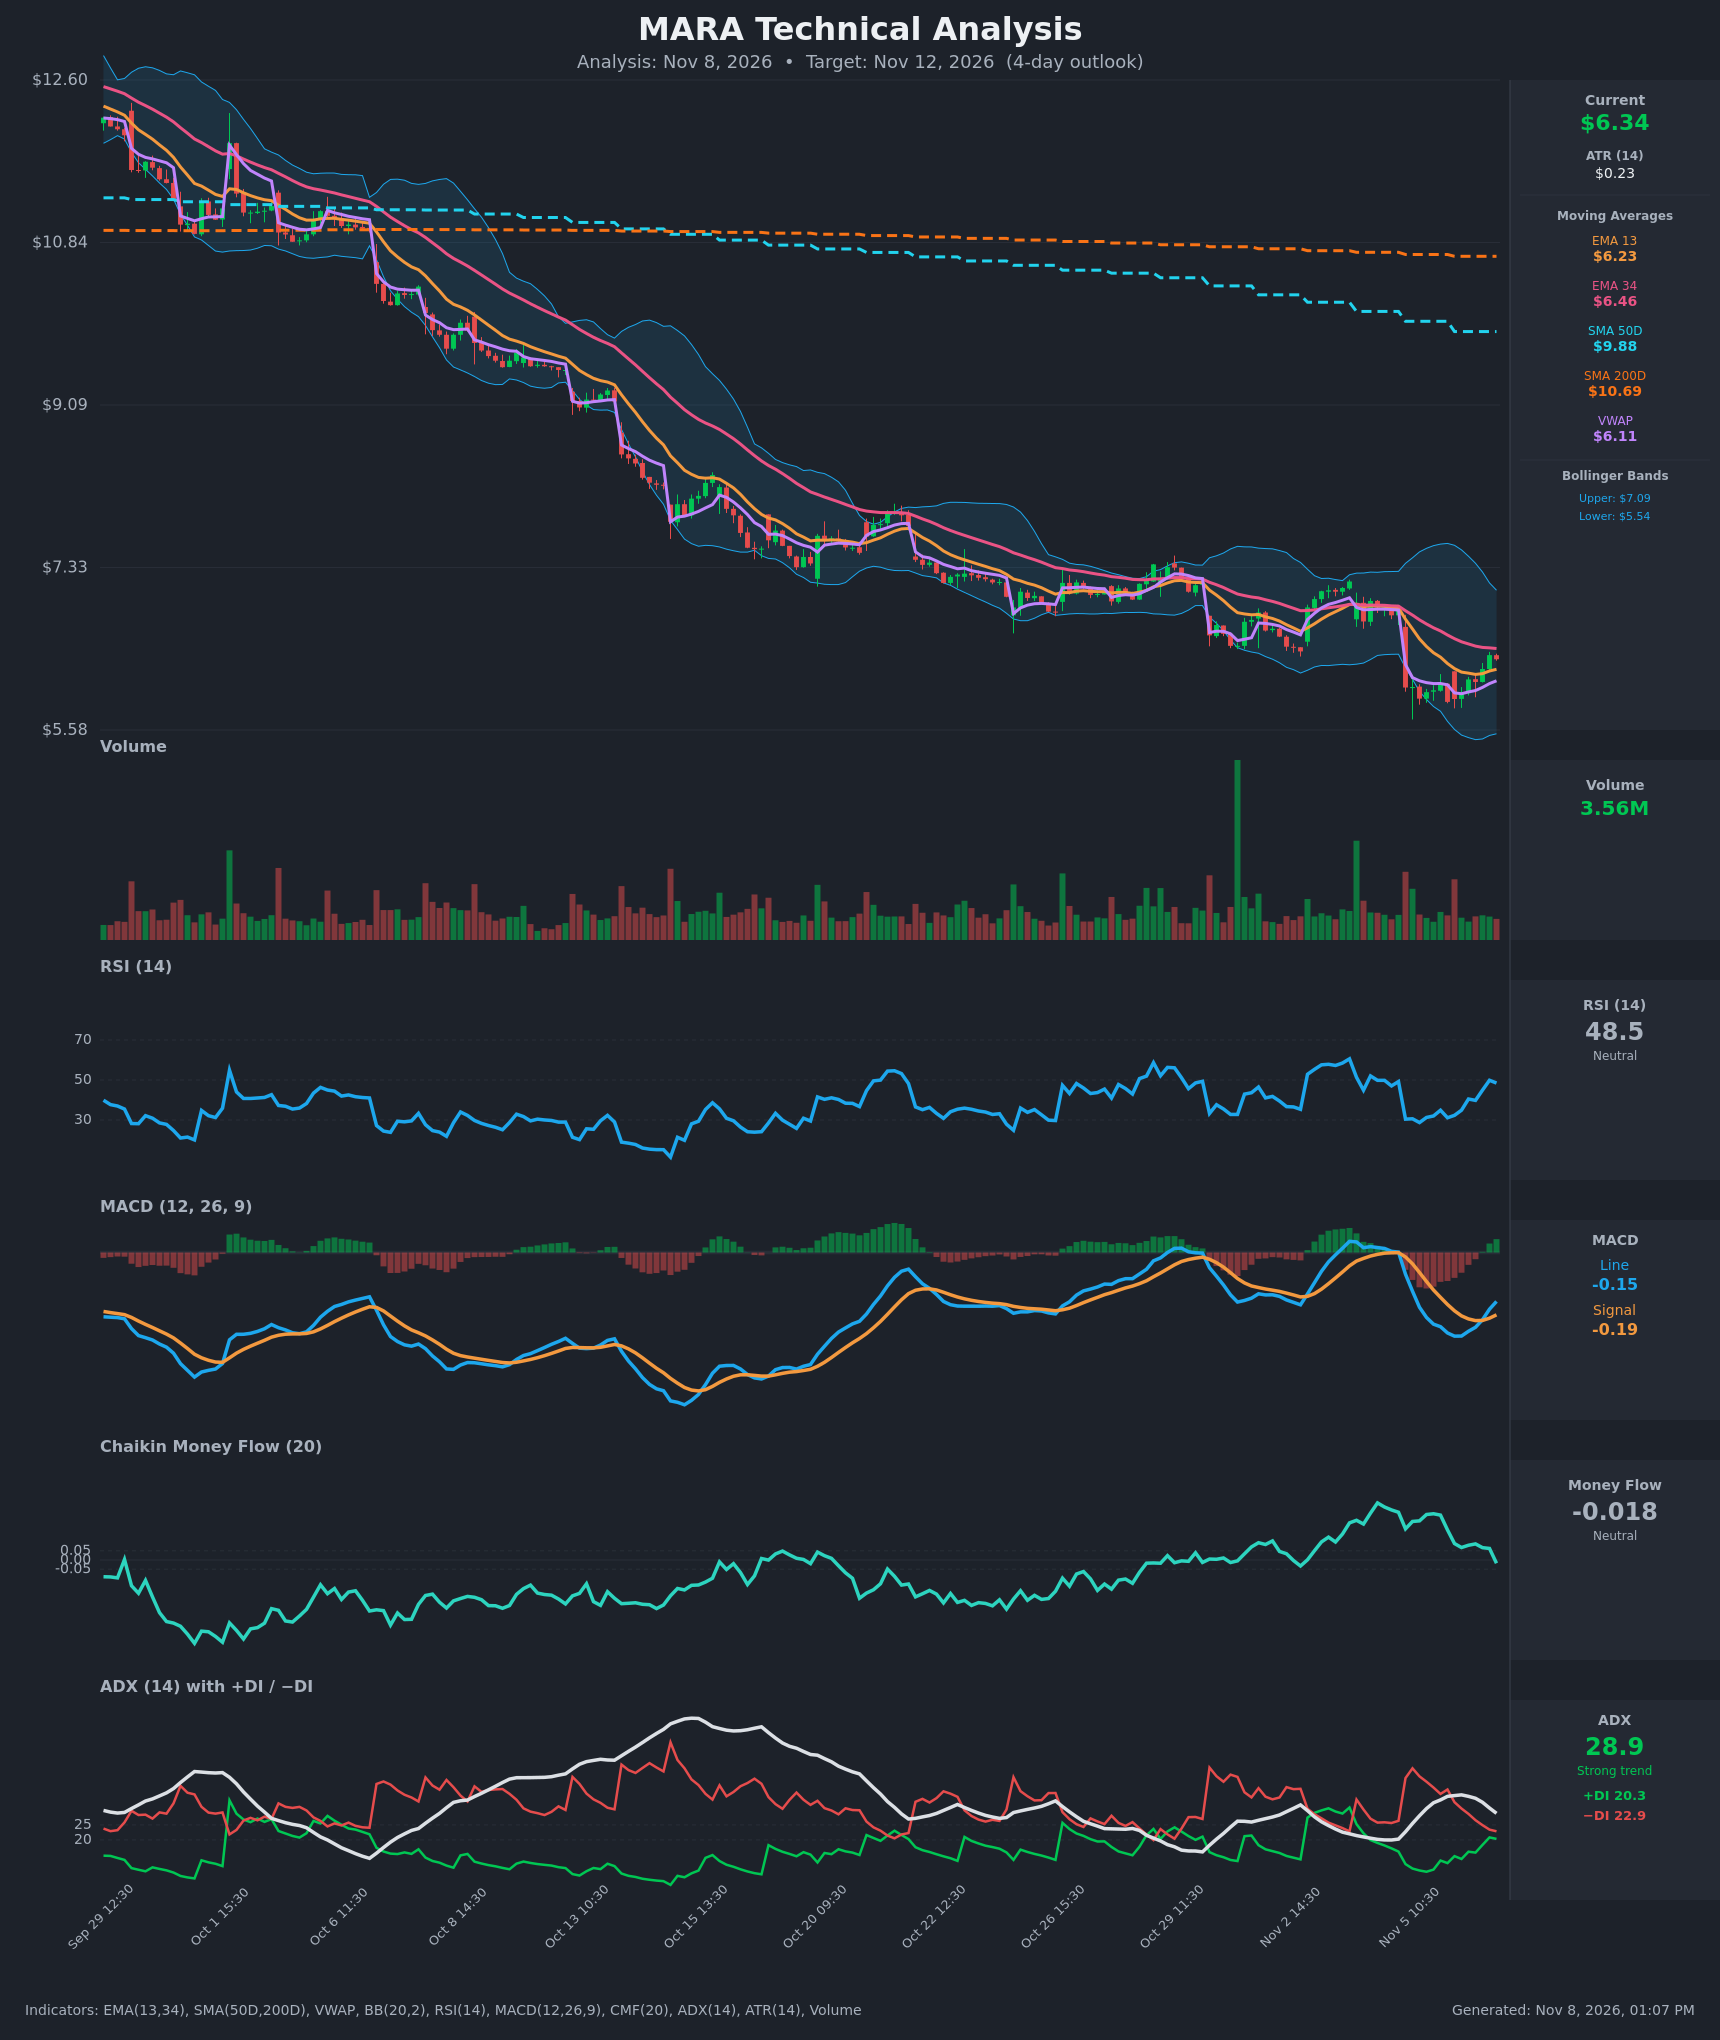
Analysis
TECHNICAL INDICATORS
- RSI (14): 48.47, up from a low of about 28.7 on Nov 5 and now back near the 50 midline. Momentum has recovered sharply but has stalled just under 50. [Neutral]
- 20 EMA: The chart shows EMA 13 at $6.23 and EMA 34 at $6.46. Price at $6.34 is above the EMA 13, which is acting as short-term support, but below the EMA 34, which is overhead resistance. EMA 13 is still below EMA 34, so there is no bullish crossover. [Neutral]
- MACD: Line -0.152 is above Signal -0.194, a bullish crossover on Nov 6 around 13:30. Both lines are still below zero, and the histogram has just turned positive. This is a recovery inside a larger downtrend. [Bullish]
- Bollinger Bands (20): Upper $7.09, lower $5.54, middle about $6.31. Price is sitting on the midline after bouncing off the lower band. The bands are wide after the Nov 5 flush, and the midline is sloping down. [Neutral]
- CMF (20): -0.018, inside the ±0.05 neutral zone. It has faded from +0.26 to slightly negative in the last few bars, so buying pressure is fading. [Neutral]
- ADX (14): 28.9, a strong trend but falling from 35. −DI (22.9) is still above +DI (20.3), though the gap has narrowed from about 30 points to 2.6. The bearish trend is losing strength and a DI crossover is close. [Strong Trend – Bearish, weakening]
- Volume: 3.56M, unremarkable. The bounce from the Nov 5 low has come on average volume without a surge, so conviction is limited. [Neutral]
DIVERGENCES & TRENDS
- Price is far below SMA50D ($9.88) and SMA200D ($10.69). SMA50D is well below SMA200D, so the death cross is long established and the long-term trend is firmly bearish.
- The weekly pattern is a staircase of lower highs and lower lows, with gap-downs at the open, the latest on Nov 5 (from $6.88 to $6.04).
- Over the last 8 bars, RSI has rebounded from the high 20s to 48.5, MACD has crossed up, and −DI has dropped from 43.8 to 22.9. This is a short-term relief bounce.
- Price made a low near $5.9 while RSI made a low near 29 on Nov 5. There is no clear divergence, but momentum is improving.
- The last bar shows CMF dropping below zero as price stalled at $6.34. The bounce is meeting EMA 34 resistance at $6.46 and VWAP-anchored support at about $6.11.
CHART PATTERNS
- The decline from $12.60 is a long-running downtrend channel, and the recent action is a small Bearish Flag/Pennant-type consolidation. After the sharp drop to ~$5.9, price is retracing up toward the EMA 34 and the former breakdown level near $6.88.
- A Bullish Falling Wedge is possible if price breaks above $6.46–6.50. That is not confirmed, and the downtrend structure argues against relying on it.
- The bearish continuation measured move points to a retest of $5.90 and then the $5.54 lower band. A rejection at $6.46–6.88 would confirm it.
POTENTIAL SCENARIOS
- Scenario 1: Bearish Rejection at EMA 34 / Trend Resumption — The relief bounce stalls at the EMA 34 ($6.46) and the declining midline. CMF is turning negative and −DI is still above +DI in a strong trend, and gap-down behavior has dominated recent weeks. Trigger: failure to close above $6.46, then a break below $6.11 (VWAP/EMA 13). Target: $5.90–$5.75. Invalidation: close above $6.60. (50% probability)
- Scenario 2: Bullish Relief Rally — The MACD crossover and DI convergence extend the bounce through $6.46, with a push toward the prior breakdown zone. Trigger: close above $6.46 on rising volume. Target: $6.75–$6.90. Invalidation: close below $6.10. (32% probability)
- Scenario 3: Neutral Chop — Price oscillates between $6.10 and $6.46 as the ADX decays. Trigger: no break of either level. Target: $6.20–$6.40. Invalidation: a close outside the range. (18% probability)
PRICE TARGETS
For a 4-day timeframe the range width is about 5–6% of price, consistent with the ~4–8% guidance for 4 days.
- Target Price: $6.17
- Expected Range: $5.82 to $6.60 (width $0.78 ≈ 12%, roughly 3.4× ATR. This is wider than guidance, but MARA has gapped daily by 10%+, so this range is deliberately kept as tight as ATR allows)
- Key Levels: Support at $6.11, Resistance at $6.46
OVERALL BIAS
OVERALL BIAS: BEARISH - Price remains in a persistent downtrend below both the 50- and 200-day SMAs, with −DI still above +DI, CMF slipping negative, and the bounce running into EMA 34 resistance at $6.46. The MACD crossover and recovering RSI argue for a bounce, but the weight of evidence favors a fade lower.
This is educational analysis and not financial advice.