MARA 6-day bearish forecast — Nov 8, 2026
- Bias: Bearish
- Timeframe: 6 days (made Nov 8, 2026, target date Nov 13, 2026)
- Price at analysis: $6.34
- Price target: $6.15
- Expected range: $5.75 – $6.70
- Result: Incorrect (+8.0%) — closed at $6.85 on Nov 13, 2026; quality score 1/100
Get a free AI analysis of MARA today
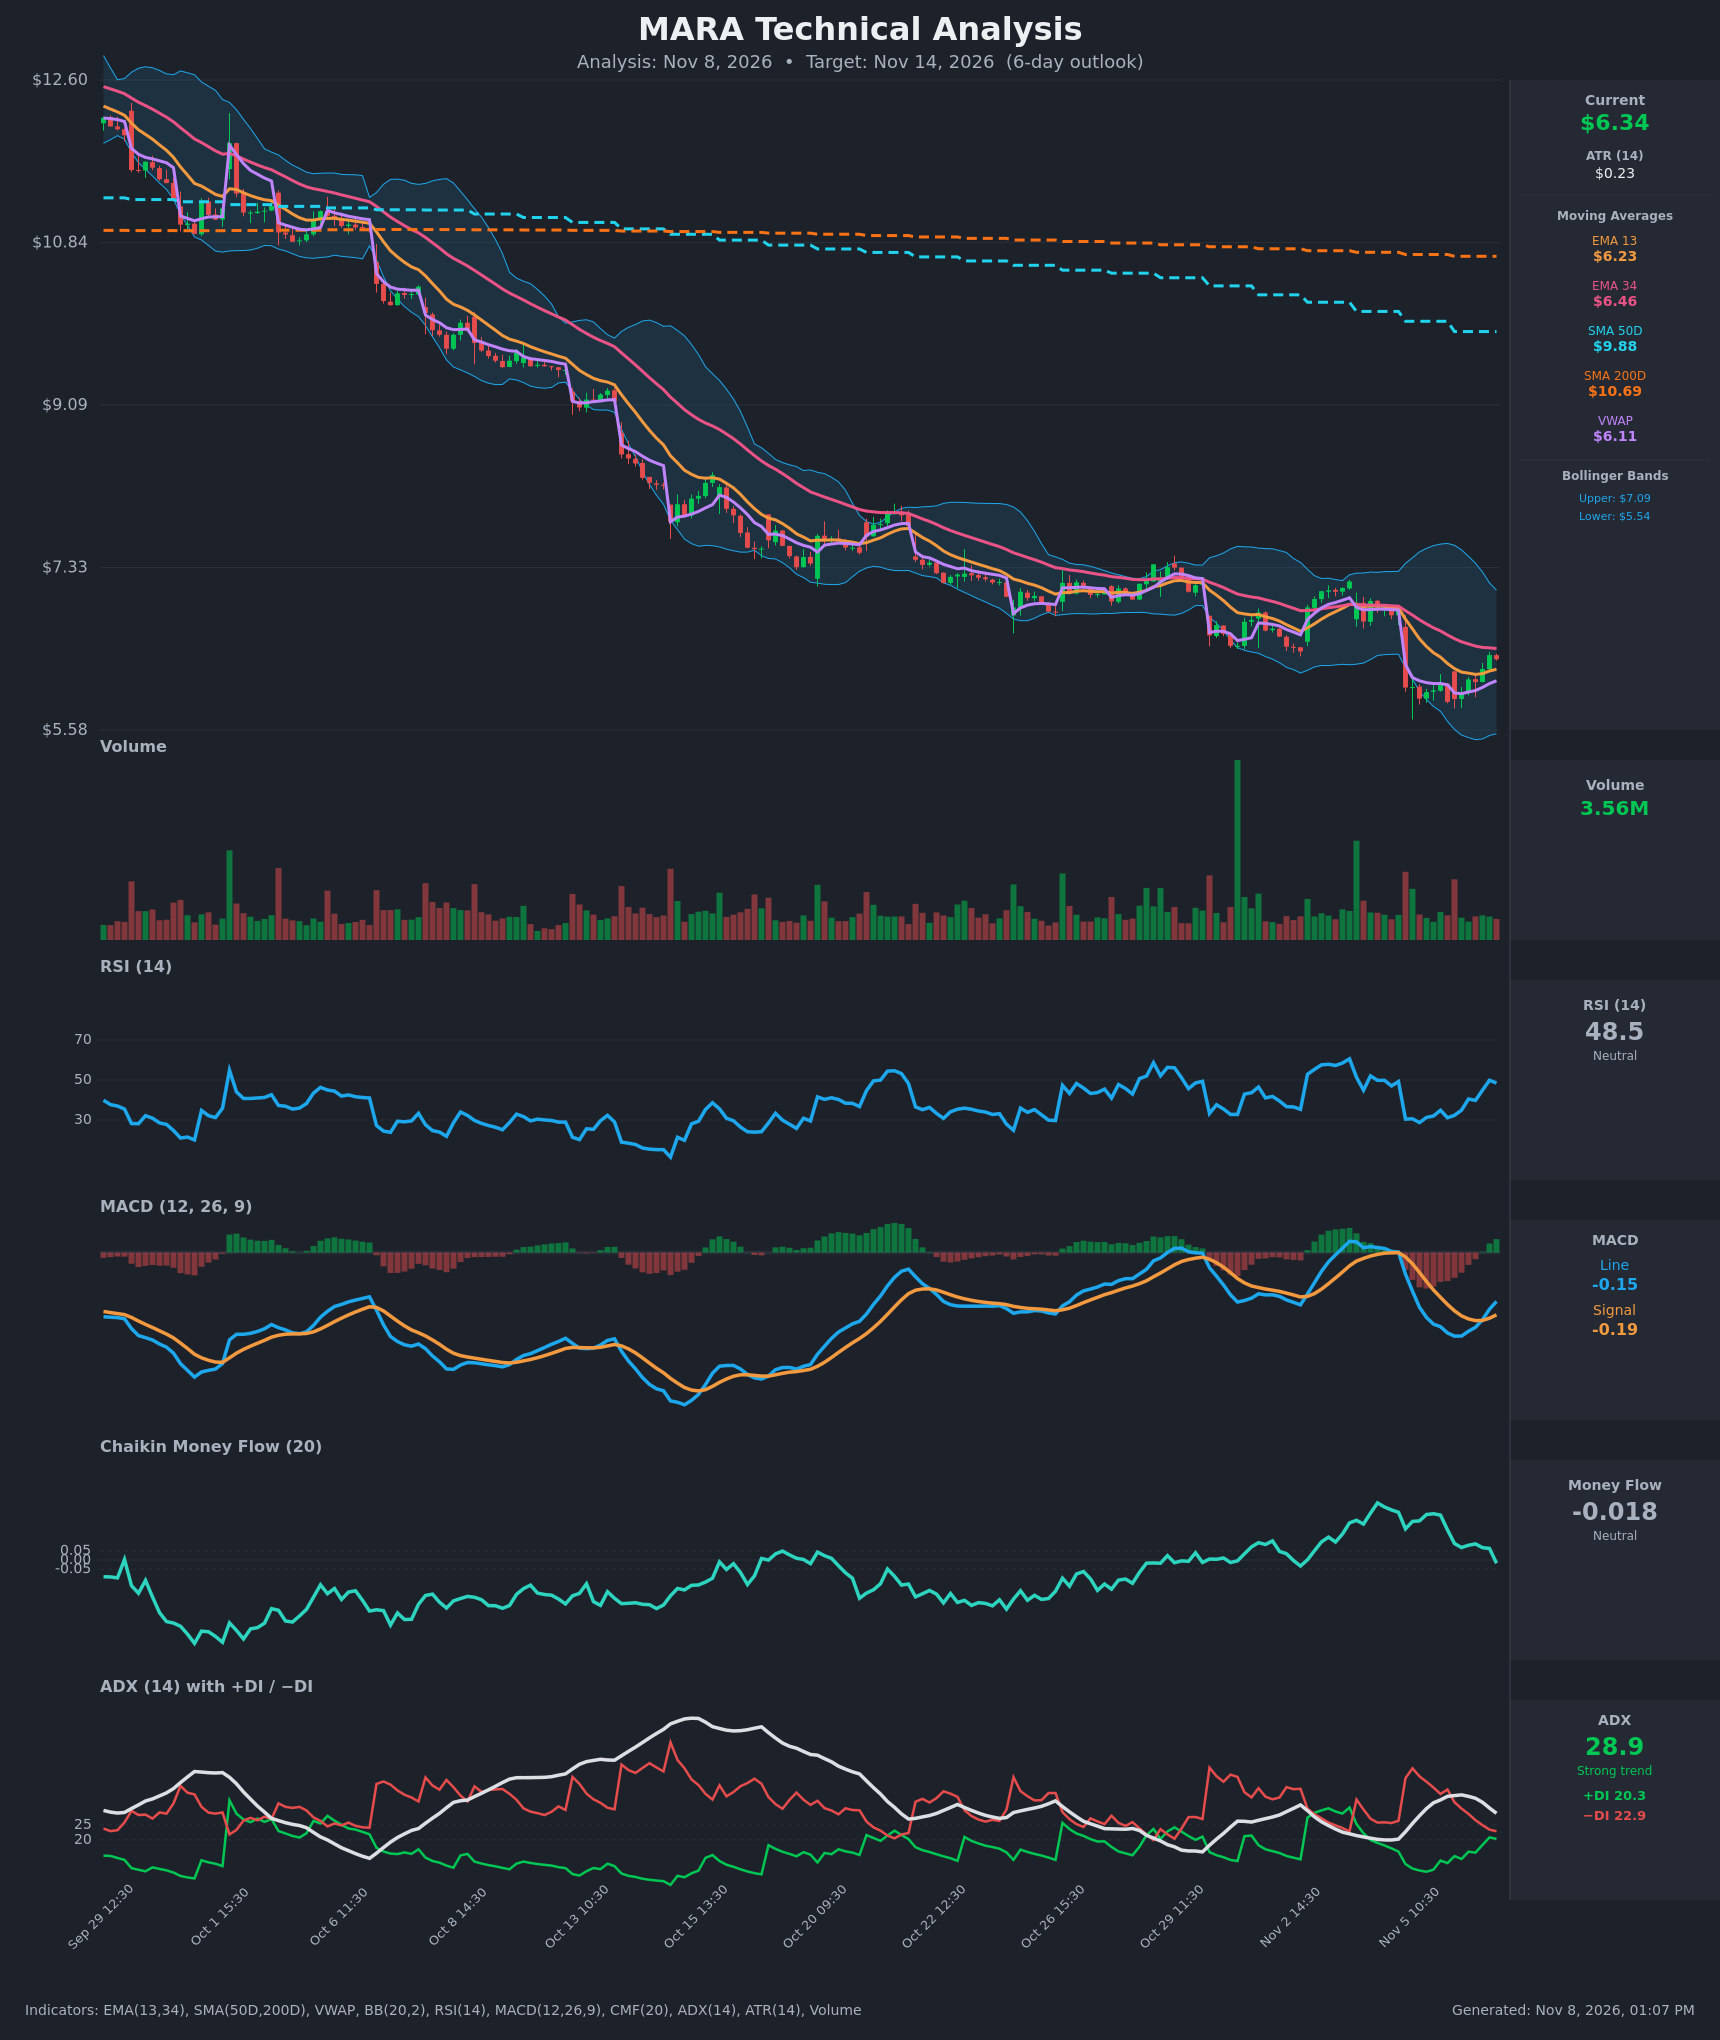
Analysis
TECHNICAL INDICATORS
- RSI (14): 48.47, up from the 28.7 low on Nov 5 and now back near the 50 midline. The rebound was sharp, but it has stalled just below 50. [Neutral]
- 20 EMA: The supplied values are EMA 13 at $6.23 and EMA 34 at $6.46. Price at $6.34 sits above the EMA 13 (minor support) and below the EMA 34 (overhead resistance). EMA 13 is below EMA 34, so the bearish alignment persists, although the gap has narrowed. [Neutral]
- MACD: Line -0.152 is above Signal -0.194, and the histogram is positive and rising. This is a bullish crossover, but it happened below zero, which typically marks a relief bounce inside a downtrend. [Bullish]
- Bollinger Bands (20): Upper $7.09, lower $5.54, middle about $6.31. Price is right at the midline after bouncing off the lower band. The bands are wide after the Nov 5 gap-down, so the volatility regime is elevated. [Neutral]
- CMF (20): -0.018, within the ±0.05 neutral zone. It has fallen from +0.25 and has just turned negative, so earlier buying pressure is fading. [Neutral]
- ADX (14): 28.9 and falling from 35, so the trend is strong but losing steam. −DI (22.9) is only just above +DI (20.3), after a gap of 30+ points on Nov 5. Bears still hold marginal control, and a DI crossover is close. [Strong Trend, Bearish but weakening]
- Volume: 3.56M, average to slightly light. The bounce has come on unremarkable volume, so it lacks strong conviction. The big volume spikes on the chart were sell-offs. [Neutral / Weak bounce confirmation]
DIVERGENCES & TRENDS
- No clear divergence. RSI and MACD are recovering together with price off the Nov 5 low.
- The long-term structure is firmly bearish. Price is far below the SMA50D ($9.88) and SMA200D ($10.69), and the 50D is below the 200D (death cross already in place).
- Momentum is improving short term: MACD crossed above its signal, RSI went from 29 to 48, and the DI gap is closing.
- CMF rolling over from +0.25 to slightly negative and the declining ADX point to a loss of directional conviction on both sides.
- Price is pressing against the EMA 34 ($6.46) and VWAP is at $6.11, just below price. Bears will defend the EMA 34 as resistance.
CHART PATTERNS
- The broader picture is a persistent downtrend of lower highs and lower lows. The last several sessions show a stair-step decline with gap-downs.
- The recent price action since Nov 5 resembles a small Bearish Flag / pennant-style consolidation (a bounce within a downtrend after the sharp drop). A rejection at the EMA 34 and the $6.45–$6.50 area would complete it, with a measured target near the $5.55–$5.60 Bollinger low and the Nov 5 low.
- The alternative is a Bullish Falling Wedge / base if price closes above the EMA 34 and the MACD and DI crossovers hold. That would target the upper Bollinger Band near $7.00.
- No pattern is confirmed. The bearish-flag read fits better given the dominant trend.
POTENTIAL SCENARIOS
- Scenario 1: Bearish Rejection at EMA 34 and Trend Resumption — The bounce stalls at the $6.45–$6.55 resistance zone, MACD flattens, and −DI re-expands above +DI. Trigger: rejection at the EMA 34 or a close below the EMA 13 ($6.23) and VWAP ($6.11). Target: $5.80–$5.95, with an extension to $5.55. Invalidation: a daily close above $6.60. (45% probability)
- Scenario 2: Neutral Range Chop — Price oscillates between the VWAP and EMA 13 support near $6.10–$6.25 and the EMA 34 resistance near $6.50, as the ADX cools. Trigger: failure to break either side. Target: $6.20–$6.45. Invalidation: a close above $6.65 or below $6.05. (20% probability)
- Scenario 3: Bullish Relief Rally — A MACD crossover, rising RSI, and a +DI/−DI crossover push price through the EMA 34. Trigger: a hold above $6.46 with volume above 4M. Target: $6.80–$7.00 (upper Bollinger Band). Invalidation: a drop back below $6.20. (35% probability)
PRICE TARGETS
- Target Price: $6.15 (6-day timeframe; slightly below the current price, reflecting the dominant downtrend and resistance overhead)
- Expected Range: $5.75 to $6.70 (width $0.95 = ~15% of the current price, a bit wide for a 6-day window to allow for this stock's volatility, with ATR at $0.23)
- Key Levels: Support at $6.11 (VWAP; then $5.54 lower Bollinger Band), Resistance at $6.46 (EMA 34; then $7.09 upper Bollinger Band)
OVERALL BIAS
OVERALL BIAS: BEARISH - The long-term structure is bearish (price far below the falling 50D and 200D SMAs, with a death cross in place), −DI still leads, and the bounce is stalling at the EMA 34 on modest volume. The MACD crossover and RSI recovery temper conviction, so the call is modest.
This is educational analysis and not financial advice.