EEM 6-day bearish forecast — Nov 8, 2026
- Bias: Bearish
- Timeframe: 6 days (made Nov 8, 2026, target date Nov 13, 2026)
- Price at analysis: $59.32
- Price target: $58.70
- Expected range: $57.20 – $60.50
- Result: Incorrect (+2.2%) — closed at $60.61 on Nov 13, 2026; quality score 43/100
Get a free AI analysis of EEM today
Analysis
TECHNICAL INDICATORS
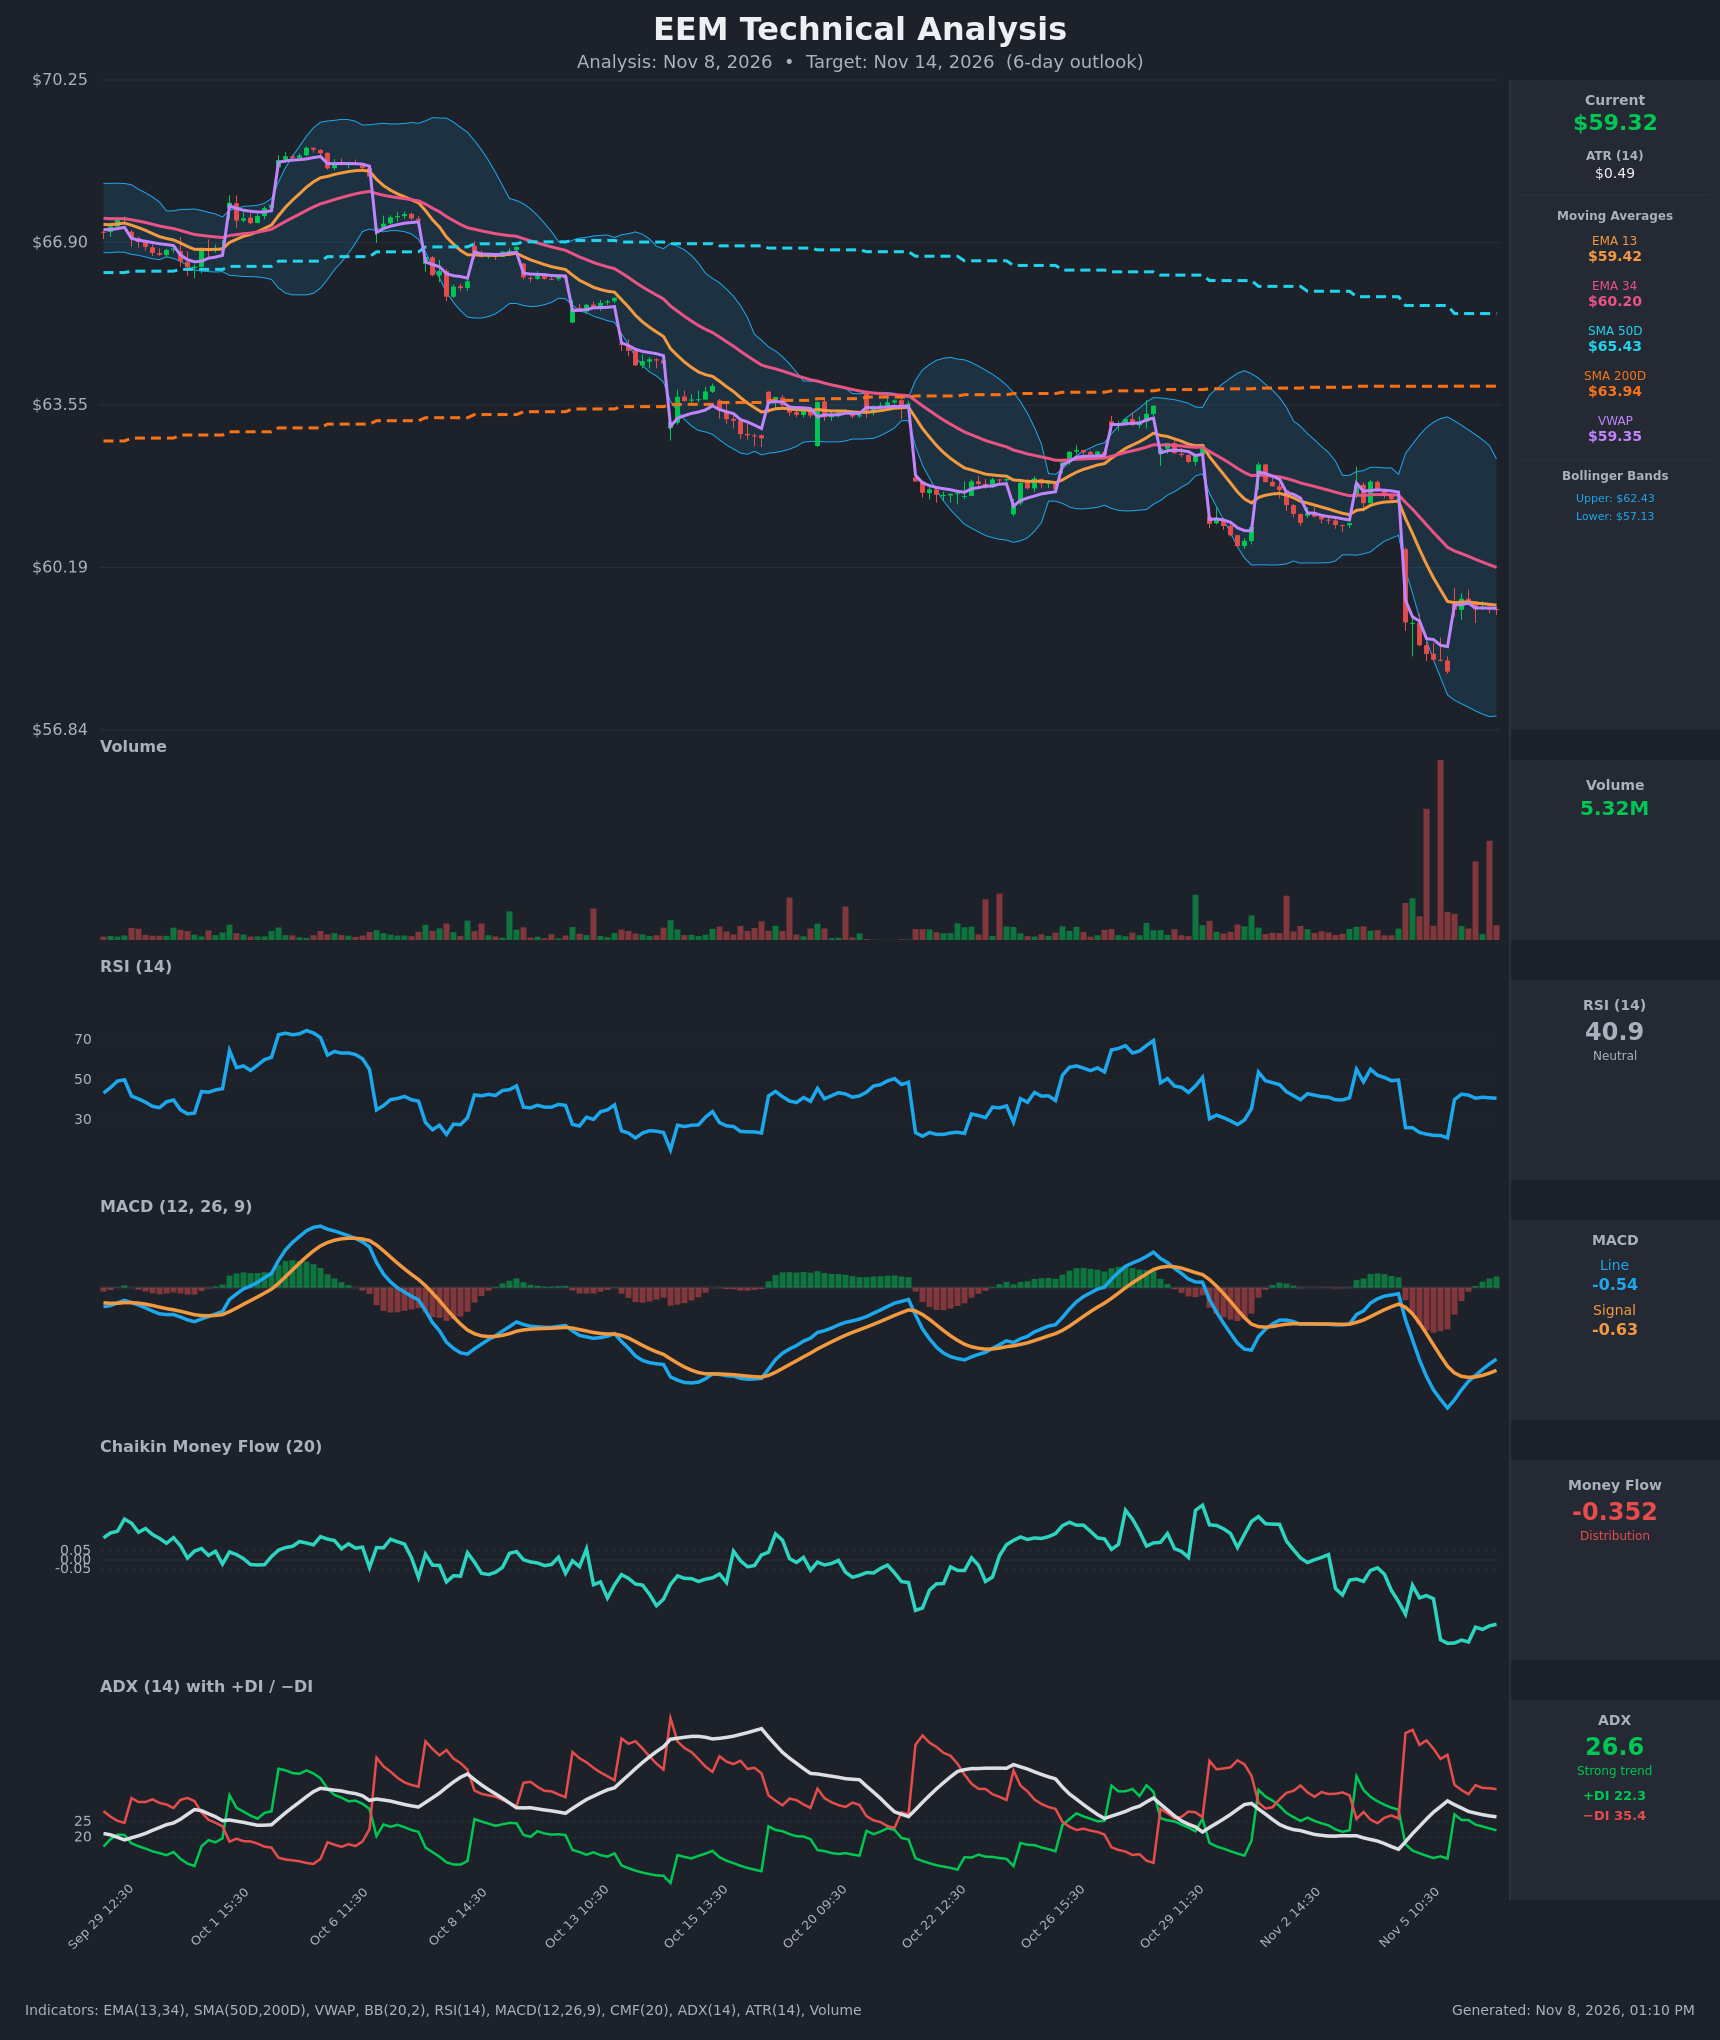
- RSI (14): 40.89. It bounced from deeply oversold (~21) on Nov 5 and has flatlined in the low 40s for the last several bars. The reading is below 50 and shows no bullish follow-through. [Bearish]
- 20 EMA: The chart shows EMA 13 at $59.42 and EMA 34 at $60.20. Price at $59.32 sits just below the EMA13 and below the EMA34, so both act as overhead resistance. EMA13 is below EMA34, a bearish alignment. [Bearish]
- MACD: The line is -0.540 against a signal of -0.625. It has crossed above the signal from deeply negative levels, so the histogram is slightly positive and rising. This is a modest bullish momentum turn, but it is still well below zero and looks like a relief bounce within a downtrend. [Neutral]
- Bollinger Bands (20): Upper $62.43, lower $57.13, middle ≈ $59.78. Price is slightly below the midline after a sharp drop to the lower band on Nov 5. The bands are very wide, reflecting elevated volatility after the gap-down. [Neutral]
- CMF (20): -0.352, deep in distribution and near the lowest level on the chart. There is no sign of accumulation. [Distribution]
- ADX (14): 26.6 with −DI at 35.4 above +DI at 22.3. ADX has eased from ~31.7 but is still above 25, so the trend is strong and bearish-controlled. The DI spread has narrowed from the Nov 5 extremes. [Strong Trend - Bearish]
- Volume: 5.32M on the latest bar. There were massive volume spikes on the Nov 5 breakdown, which suggests capitulation or distribution. Volume has faded during the sideways bounce, which means the rebound lacks conviction. [Bearish bias on breakdown, weak bounce]
DIVERGENCES & TRENDS
- Trend: EEM is in a clear, persistent downtrend with lower highs and lower lows since early October. Price is below SMA50D ($65.43) and SMA200D ($63.94), and SMA50D is well above SMA200D with a falling slope. This is a long-term weakening structure with no death cross yet, but the 50-day is rolling over.
- Moving averages: EMA13 is below EMA34 and the gap is widening slowly. The Nov 5 gap-down broke the Oct support zone near $61.
- MACD: It crossed bullishly (line above signal) on the last bars, but both lines remain below zero. Price is basing at $59.3, so this is a minor momentum recovery rather than a divergence.
- RSI: A potential minor bullish divergence from the Nov 5 low (RSI 21), but RSI stalled at ~41 without breaking 50.
- VWAP: Price ($59.32) is essentially equal to VWAP ($59.35), a neutral reading, but each bounce stalls here.
- Consolidation: Price has been flat in a tight $59.3-$59.55 band for 7 bars after the gap, a small base/flag-like pause under the EMAs.
CHART PATTERNS
- Bearish Flag/Pennant (continuation): The sharp Nov 5 drop (the pole) is followed by a tight, low-volume sideways consolidation just under the EMA13. This resembles the bearish flag/pennant in the reference diagram. A break below ~$59.0 projects a measured move toward $57.0 (the lower Bollinger Band and the Nov 5 low at ~$57.9).
- Gap-fill risk: The upside is capped by the gap area near $60.2-$61.0 and the EMA34.
- Larger structure: A series of lower highs and lower lows, which is a descending channel and bearish.
POTENTIAL SCENARIOS
- Scenario 1: Bearish Flag Breakdown — Price fails to reclaim the EMA13/EMA34 and breaks below the consolidation low, with −DI dominant and CMF deeply negative. Trigger: close below $59.00. Target: $57.90 and possibly $57.13 (lower Bollinger Band). Invalidation: close above $60.20 (EMA34). (50% probability)
- Scenario 2: Neutral Sideways Consolidation — Price continues to chop between support near $58.60 and resistance near $60.00 while the MACD turn and the oversold bounce offset the heavy selling. Trigger: holds $58.60-$60.00. Target: $59.00-$59.80. Invalidation: close outside the range. (25% probability)
- Scenario 3: Bullish Relief Rally — The MACD crossover and the oversold bounce extend into a mean-reversion move up to the EMA34 and the gap. Trigger: close above $60.20 on rising volume. Target: $61.00-$61.50. Invalidation: drop back below $59.00. (25% probability)
PRICE TARGETS
- Target Price: $58.70 (6-day horizon)
- Expected Range: $57.20 to $60.50 (width $3.30 ≈ 5.6% of price, consistent with a ~6-day window and ATR of $0.49, which gives ≈ $1.2 typical 6-day move, extended for the current high volatility)
- Key Levels: Support at $57.90, Resistance at $60.20
OVERALL BIAS
OVERALL BIAS: BEARISH - Price is below all key moving averages with −DI dominant, ADX above 25, and deeply negative CMF. The tight consolidation under the EMAs after a high-volume breakdown resembles a bearish flag, and the MACD bounce looks like a minor relief move within the downtrend.
This is educational analysis and not financial advice.