EEM 4-day bearish forecast — Nov 8, 2026
- Bias: Bearish
- Timeframe: 4 days (made Nov 8, 2026, target date Nov 11, 2026)
- Price at analysis: $59.32
- Price target: $58.85
- Expected range: $57.85 – $60.05
- Result: Incorrect (+4.0%) — closed at $61.68 on Nov 11, 2026; quality score 9/100
Get a free AI analysis of EEM today
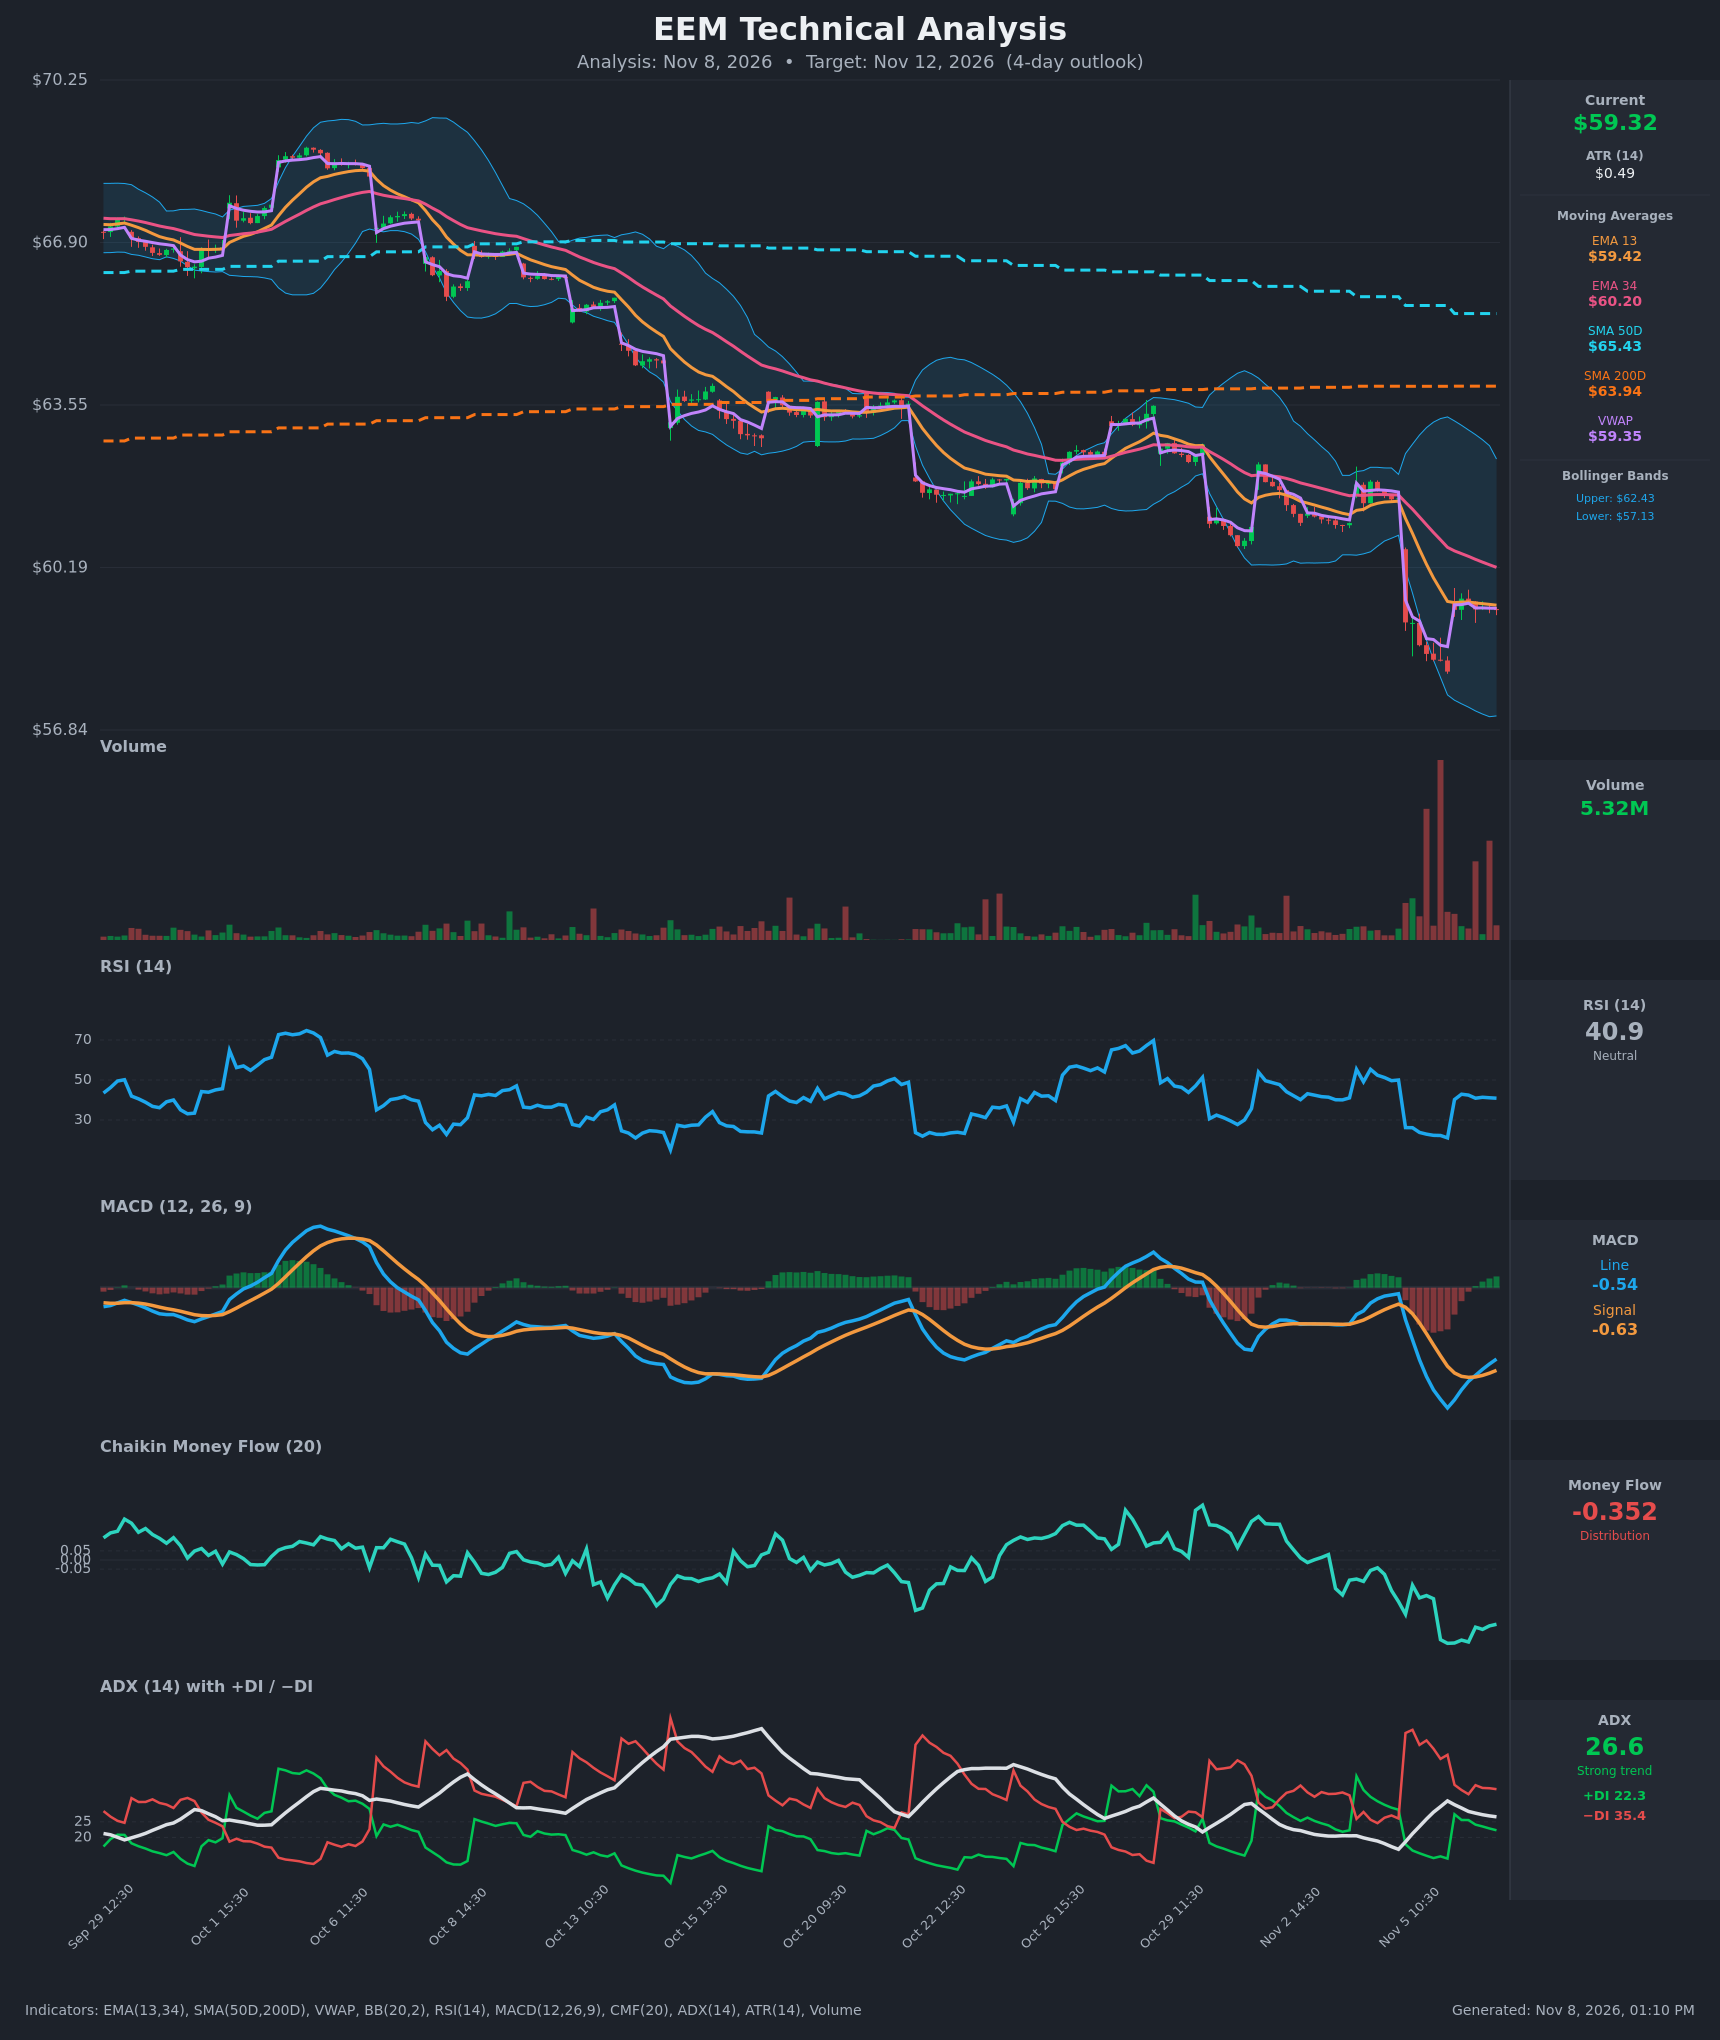
Analysis
TECHNICAL INDICATORS
- RSI (14): 40.89. It bounced from deeply oversold (21–22) on Nov 5 to about 41 and has been flat in the 40–43 range since the Nov 6 open. That is a relief bounce, not a momentum reversal, and RSI is still below 50. [Bearish]
- 20 EMA: The chart uses EMA 13 at $59.42 and EMA 34 at $60.20. Price at $59.32 sits just under EMA 13 and below EMA 34, which has been falling steadily. EMA 13 is below EMA 34 (bearish alignment), and the gap is narrowing only slowly. [Bearish]
- MACD: Line -0.540, signal -0.625, so the histogram is +0.085. The line crossed above the signal on Nov 6 around 12:30 and is recovering from a trough near -0.91. Both lines are still well below zero, so this is a counter-trend bounce inside a bearish regime. [Neutral]
- Bollinger Bands (20): Upper $62.43, lower $57.13, mid about $59.78. Price is in the lower half of the bands, below the midline. The bands are very wide after the Nov 5 gap-down, which signals elevated volatility. The lower band was tagged and held on Nov 5. [Neutral]
- CMF (20): -0.352, deep in distribution territory (well below -0.05). It has stayed negative through the bounce, so heavy selling volume from the gap-down is still weighing on money flow. [Distribution]
- ADX (14): 26.6 and falling from 31.7, with −DI 35.4 above +DI 22.3. The trend is still strong but losing steam, and bears are firmly in control even though the spread has narrowed from the Nov 5 extreme. [Strong Trend – Bearish]
- Volume: 5.32M on the latest bar. Volume spiked massively on the Nov 5 gap-down and has since faded to moderate levels. The bounce has come on lighter volume than the selloff, so conviction behind the rebound is limited. [Bearish-leaning; capitulation spike followed by weak bounce]
DIVERGENCES & TRENDS
- There is no clean bullish RSI divergence. RSI made a deeply oversold low as price made its low, and the bounce only brought RSI back to about 41.
- The MACD histogram turned positive (a bullish crossover), but the lines remain far below zero. This is a mean-reversion bounce.
- Price has been stuck at $59.3–59.5 for seven hourly bars. It is pinned to the VWAP ($59.35) and EMA 13 ($59.42), which points to short-term equilibrium and consolidation after the gap.
- There is a long-term bearish structure. SMA50D ($65.43) is well above SMA200D ($63.94) but falling, and price is about 7% below the SMA200D. Price has made lower highs and lower lows since early October, and the 50D is rolling over.
- ADX has declined from 31.7 to 26.6 while −DI stays dominant. The selloff is decelerating but the trend is not reversed.
CHART PATTERNS
- The broader chart shows a persistent downtrend with stair-step gap-downs, closest to a Bearish Flag/Pennant continuation in its current form. The tight sideways drift at $59.3–59.5 after the sharp Nov 5 drop is a small pennant-like consolidation.
- A flag measured-move target would project lower, toward about $58.0, which is near the Nov 5 low and just above the lower Bollinger Band at $57.13.
- A bullish alternative is a short-term relief bounce (a "Double Bottom"-style base near $58.0), but it is unconfirmed. Price would need to reclaim the EMA 34 ($60.20) to validate it.
POTENTIAL SCENARIOS
- Scenario 1: Bearish Pennant Breakdown — The consolidation under EMA 13/34 resolves lower as −DI dominance and heavy distribution (CMF -0.35) continue to pull price down. Trigger: a hourly close below $59.00 on rising volume. Target: $58.30, then $58.00. Invalidation: a close above $60.20 (EMA 34). (50% probability)
- Scenario 2: Neutral Range Consolidation — Price chops around VWAP and EMA 13 as volatility compresses after the gap, with the MACD histogram turning positive and ADX fading. Trigger: price holds $58.80–$60.00. Target: $59.20–$59.60. Invalidation: a break outside the $58.50–$60.20 range. (25% probability)
- Scenario 3: Bullish Relief Rally — Oversold bounce and a positive MACD cross extend toward the EMA 34 and the Bollinger midline. Trigger: a close above $59.80 with improving volume. Target: $60.20–$60.60. Invalidation: a drop back below $58.80. (25% probability)
PRICE TARGETS
- Target Price: $58.85 (4-day horizon)
- Expected Range: $57.85 to $60.05 (width $2.20, about 3.7% of price, in line with the 2–4% guidance for a short horizon; ATR $0.49 supports roughly ±$1.1)
- Key Levels: Support at $58.04 (Nov 5 low area, above the $57.13 lower band), Resistance at $60.20 (EMA 34)
OVERALL BIAS
OVERALL BIAS: BEARISH - −DI dominates with ADX still above 25, CMF is deeply negative at -0.35, and price sits below EMA 13/34 and well below the falling SMA50D/200D. The MACD bounce is a weak counter-trend signal that occurred on fading volume, so a modest drift lower toward $58.85 is the more probable path.
This is educational analysis and not financial advice.