SLV 6-day bullish forecast — Nov 8, 2026
- Bias: Bullish
- Timeframe: 6 days (made Nov 8, 2026, target date Nov 13, 2026)
- Price at analysis: $46.88
- Price target: $47.35
- Expected range: $45.60 – $48.40
- Result: Incorrect (-6.1%) — closed at $44.03 on Nov 13, 2026; quality score 2/100
Get a free AI analysis of SLV today
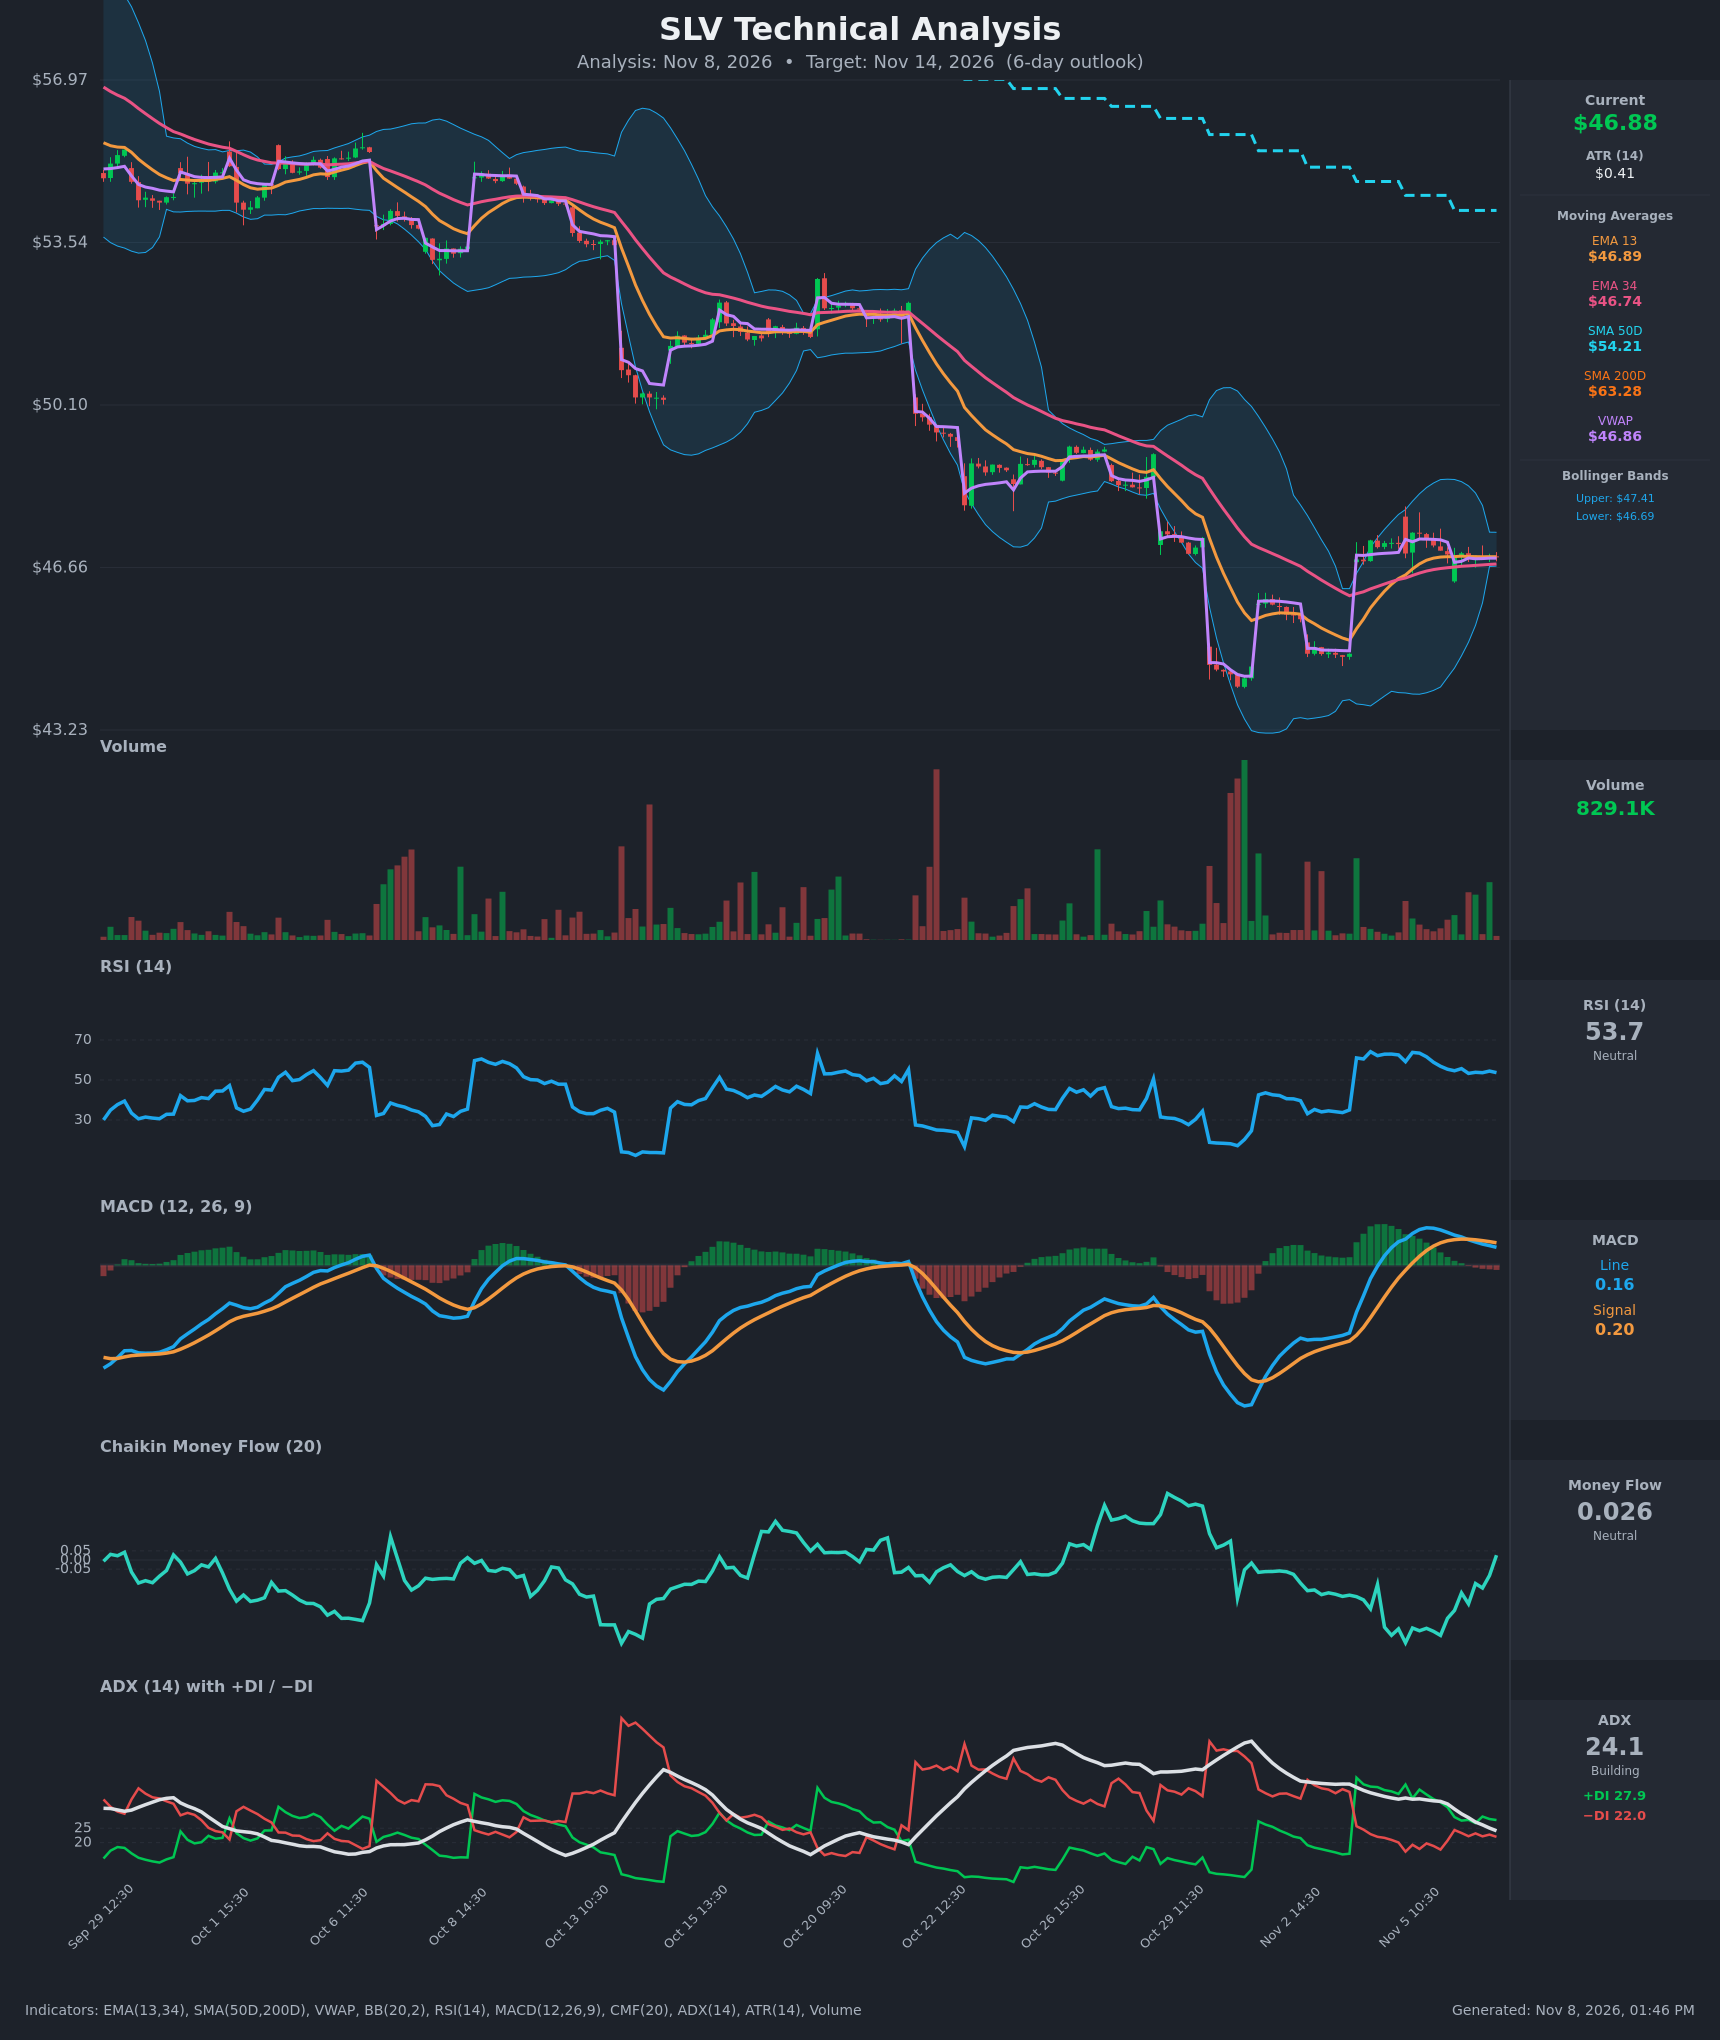
Analysis
TECHNICAL INDICATORS
- RSI (14): 53.68, flat near the midline after cooling from 63-64 on Nov 5. There is no overbought or oversold signal and momentum is neither accelerating nor collapsing. [Neutral]
- 20 EMA (EMA 13 / EMA 34 used): EMA13 is $46.89 and EMA34 is $46.74. Price at $46.88 sits right on EMA13 and just above the rising EMA34, which is the first support. EMA13 crossed above EMA34 on Nov 4 and the gap is narrowing. [Bullish]
- MACD: The line is 0.160 and the signal is 0.200. The line crossed below the signal around Nov 6 11:30 and the histogram is slightly negative. Both lines are still above zero, so this reads as a fading-momentum pause after the bounce rather than a full reversal. [Bearish]
- Bollinger Bands (20): The bands are tight at $46.69 to $47.41, a squeeze after the volatile selloff and rebound. Price is mid-band, so there is no directional edge yet, but the squeeze points to a volatility expansion. [Neutral]
- CMF (20): 0.026, up sharply from -0.41 on Nov 5 and crossing zero. Buying pressure is improving, but it is still below the +0.05 accumulation threshold. [Neutral]
- ADX (14): 24.1 and falling from 35, with +DI 27.9 above −DI 22.0. The trend is losing strength and the market is consolidating, with a mild bullish lean from the DI spread. [Weak Trend, bullish lean]
- Volume: 829.1K, subdued compared with the heavy spikes during the Oct 29-30 capitulation. Low volume in the sideways drift suggests a lack of conviction either way. [Neutral / consolidation]
Other context:
- VWAP: $46.86, essentially equal to price, so there is no edge.
- SMA50D / SMA200D: $54.21 and $63.28. Price is far below both, and the SMA50D is under the SMA200D (death cross in place). This is a dominant long-term downtrend and acts as heavy overhead resistance.
DIVERGENCES & TRENDS
- CMF: It made a strong higher swing from deeply negative while price only flattened, an early bullish money-flow improvement.
- MACD vs. price: Price is flat to slightly higher while MACD rolls over below its signal. This is a mild momentum loss that fits consolidation rather than a clear bearish divergence.
- ADX: It is declining from 35 while +DI has stayed above −DI since the Nov 3-4 bounce, so the selling trend has stalled.
- RSI: It has made lower highs since 63-64 but is holding the 50-55 zone, a neutral-to-constructive reset.
- Crossovers: The EMA13/EMA34 bullish cross is intact, and the MACD bearish cross is fresh. The long-term death cross and the falling SMAs still cap rallies.
CHART PATTERNS
- The chart shows a sharp V-shaped rebound from about $43.5 to about $47.4, followed by a tight sideways consolidation with a Bollinger squeeze. This most resembles a Bullish Pennant / Symmetrical Triangle. The flagpole is the bounce, and the narrowing range has slightly rising lows.
- The pattern is imperfect because it sits inside a much larger downtrend, so a breakout would face resistance at the declining SMAs and the prior breakdown zone near $50.
- Measured-move targets are modest for 6 days. A breakout above $47.41 points to about $48.0 to $48.4, and a break below $46.69 points to about $45.8 to $46.0.
POTENTIAL SCENARIOS
- Scenario 1: Bullish Pennant Breakout — Price holds above EMA34 and VWAP and breaks the top of the squeeze as CMF moves above +0.05. Trigger: hourly close above $47.41 on rising volume. Target: $48.00 to $48.40. Invalidation: close below $46.69 (BB lower / EMA34). (45% probability)
- Scenario 2: Bearish Rejection / Trend Resumption — The MACD bearish cross extends and sellers use the downtrend and the overhead falling SMAs to push price out of the range. Trigger: close below $46.69. Target: $45.80 to $46.00. Invalidation: close back above $47.41. (30% probability)
- Scenario 3: Neutral Range Chop — The squeeze persists on low volume and price oscillates around EMA13 and VWAP. Trigger: failure to close outside $46.69-$47.41. Target: $46.70 to $47.20. Invalidation: decisive close outside the band. (25% probability)
PRICE TARGETS
- Target Price: $47.35 (6-day horizon)
- Expected Range: $45.60 to $48.40. The width is $2.80, about 6.0% of price, which fits the 7-10 day guidance at the lower end, scaled for 6 days and about 6x ATR.
- Key Levels: Support at $46.69, Resistance at $47.41
OVERALL BIAS
OVERALL BIAS: BULLISH - A squeeze consolidation above the rising EMA34 with an improving CMF and +DI above −DI favors an upside resolution, though the fresh MACD bearish cross and the heavy overhead SMAs keep conviction modest.
This is educational analysis and not financial advice.