SLV 4-day bullish forecast — Nov 8, 2026
- Bias: Bullish
- Timeframe: 4 days (made Nov 8, 2026, target date Nov 11, 2026)
- Price at analysis: $46.88
- Price target: $47.20
- Expected range: $45.95 – $47.95
- Result: Incorrect (-0.9%) — closed at $46.45 on Nov 11, 2026; quality score 50/100
Get a free AI analysis of SLV today
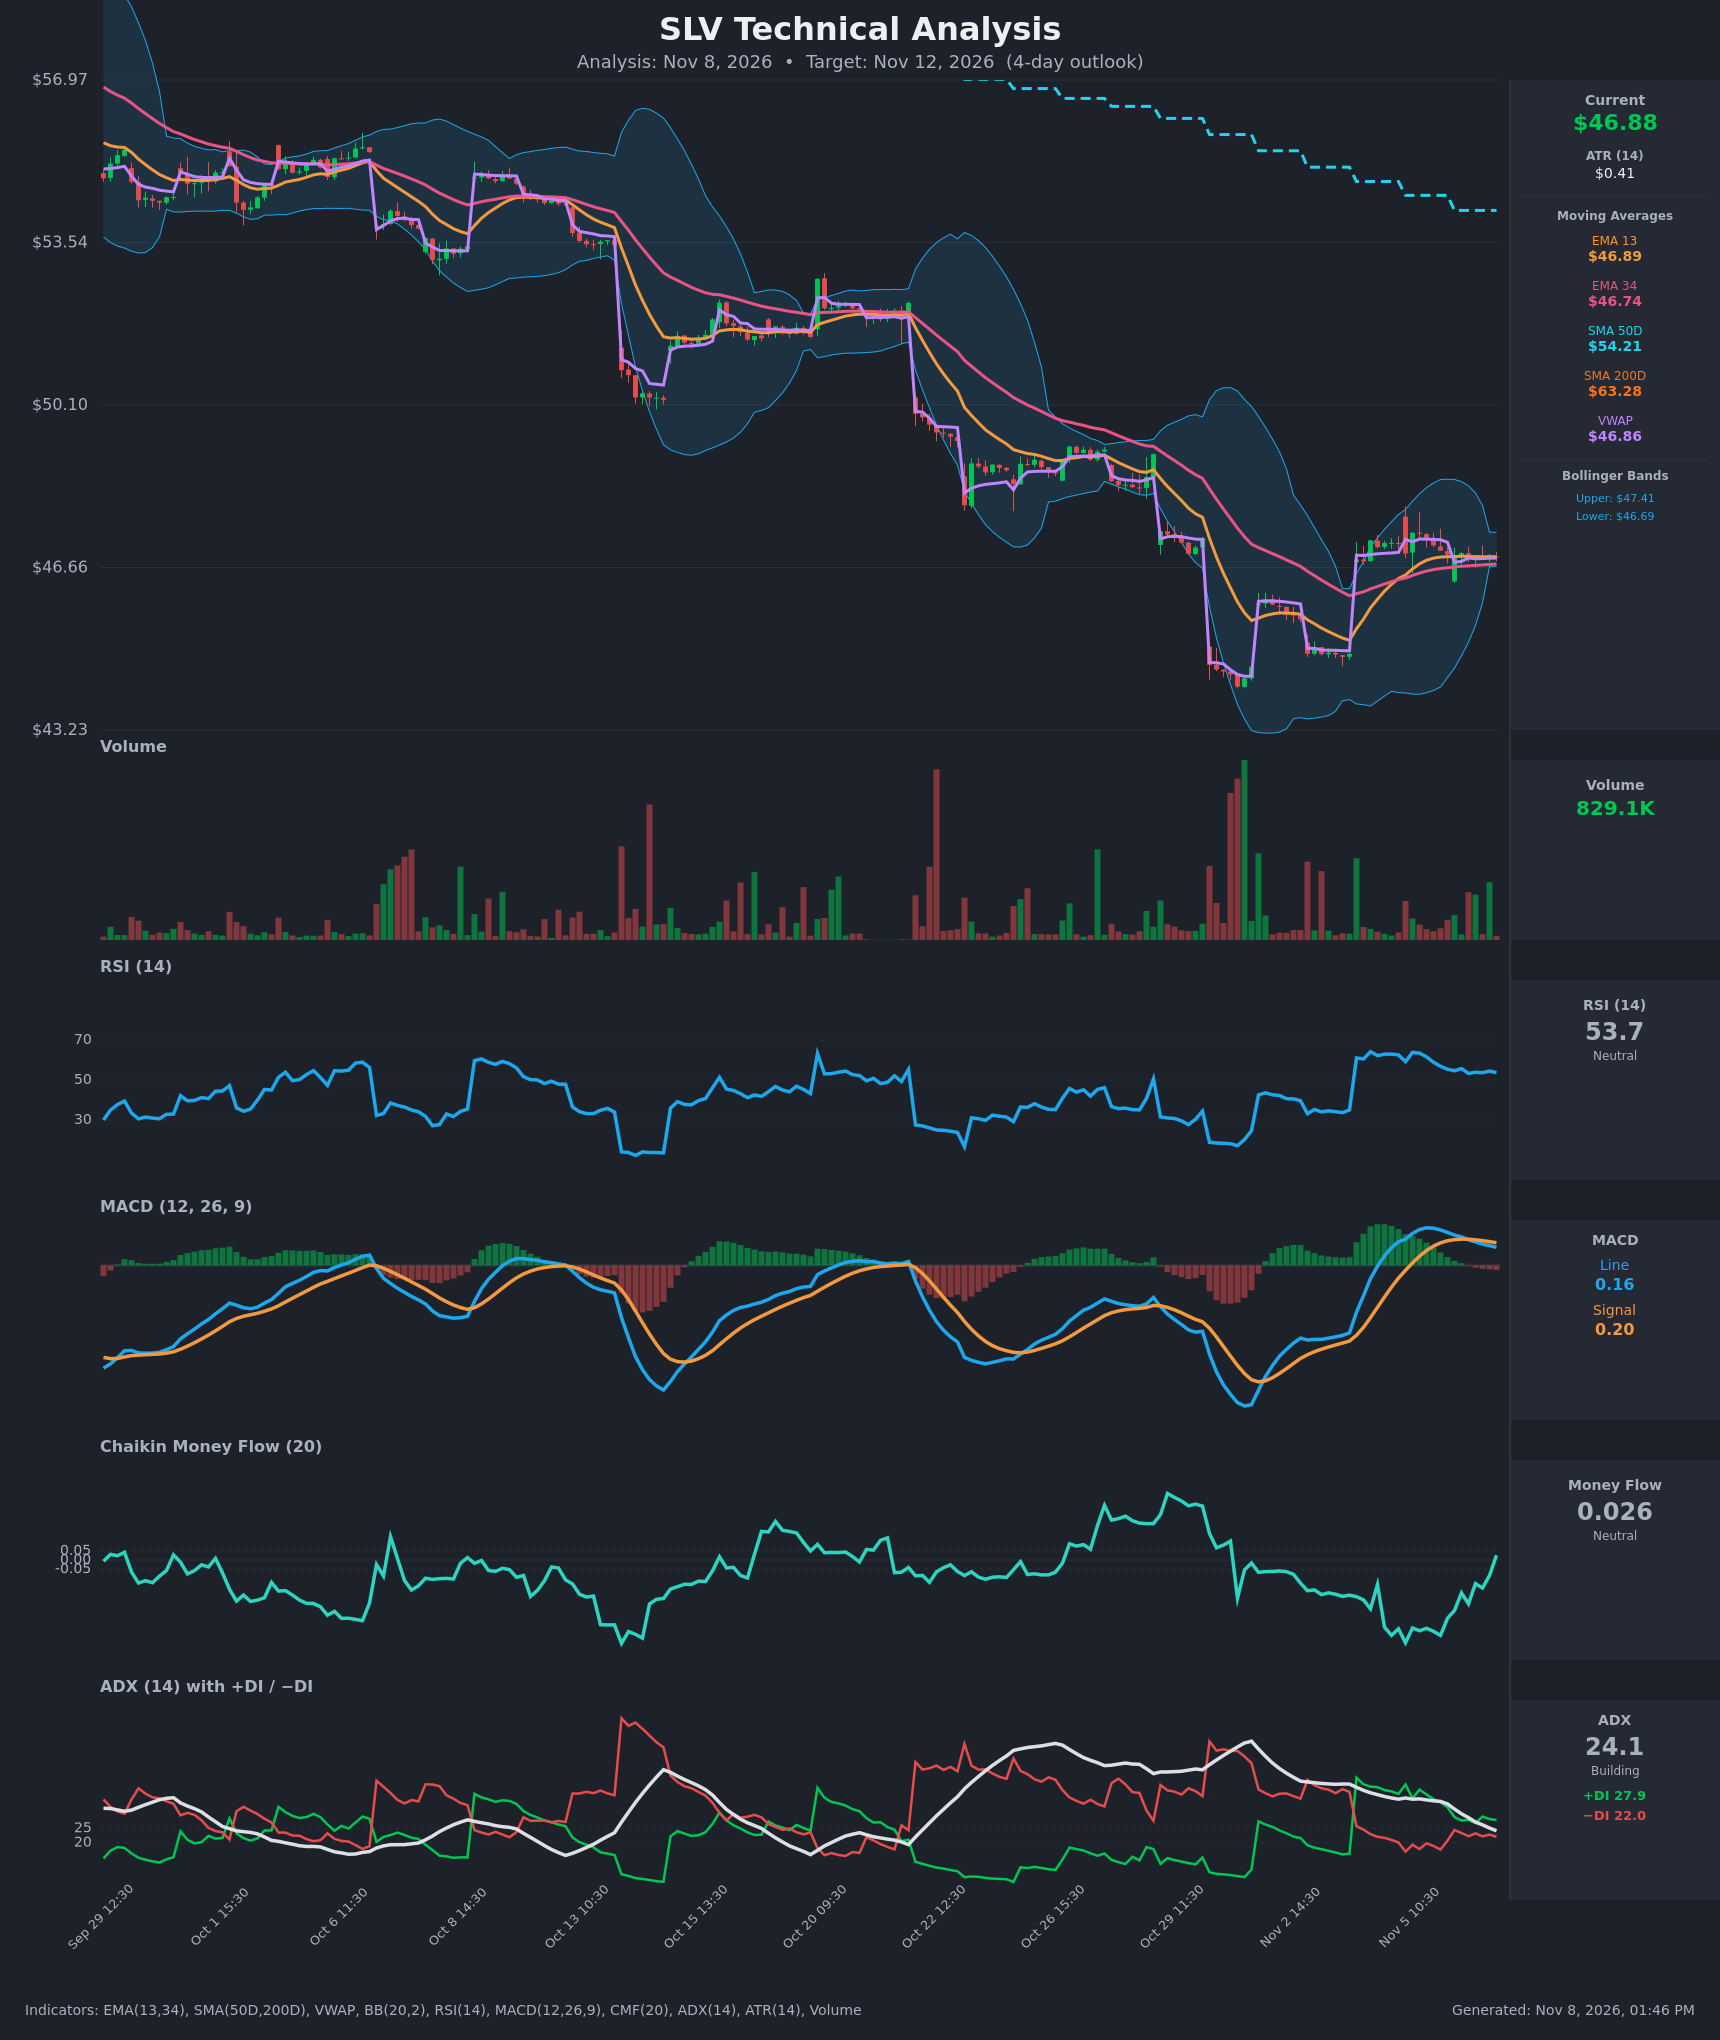
Analysis
TECHNICAL INDICATORS
- RSI (14): 53.68, mid-range and flat after easing from 63.8 on Nov 5. There is no overbought or oversold signal, and momentum has cooled without breaking down. [Neutral]
- EMA (13/34): EMA13 is $46.89 and EMA34 is $46.74. Price ($46.88) is sitting right on EMA13, and EMA13 is above the rising EMA34, a bullish short-term alignment. The gap is narrowing, so EMA34 (~$46.74) is the first support. [Bullish]
- SMA 50D / 200D: Price is far below the SMA50D ($54.22) and SMA200D ($63.28), and the SMA50D is below the SMA200D (death cross already in place). The long-term trend is firmly bearish, and both averages are far overhead. [Bearish]
- MACD: The line (0.160) is below the signal (0.200) after a bearish crossover around Nov 6 11:30. The histogram is slightly negative and fading, so short-term momentum is weakening but still above zero. [Bearish]
- Bollinger Bands (20): Upper is $47.41 and lower is $46.69. Price is in the lower half of a contracting band, a squeeze after the sharp rebound from ~$43.5. Contraction suggests a directional expansion is coming. [Neutral]
- VWAP: $46.86, with price just above it. Buyers and sellers are balanced, with a slight edge to buyers. [Neutral]
- CMF (20): 0.026, rising from -0.45 on Nov 5 and just crossing into positive territory. It is inside the ±0.05 neutral band but the improvement is a clear shift away from distribution. [Neutral]
- ADX (14): 24.1, down from 35 and falling. +DI (27.9) is above −DI (22.0), but the spread has narrowed from about 17 to 6. The rebound trend is losing strength and the market is moving toward a range. [Weak Trend, mild bullish tilt]
- Volume: 829.1K, subdued relative to the heavy-volume spikes during the late-October selloff and the bounce. Low volume in the consolidation means no strong conviction either way. [Neutral]
DIVERGENCES & TRENDS
- MACD: The bearish line/signal crossover (Nov 6) shows momentum fading after the V-shaped rebound.
- CMF: It has risen from deep negative to slightly positive while price held flat, an early bullish divergence showing selling pressure has dried up.
- ADX: It is falling from 35 while +DI and −DI converge, which points to the end of the impulse leg and sideways digestion.
- EMA13/EMA34: EMA13 crossed above EMA34 on Nov 4 and is still above it. The spread has compressed to ~$0.15, so a re-cross is possible if price slips.
- RSI: It has held 53-55 and is not diverging from price.
- Big picture: Price has made a series of lower lows and lower highs since the $56+ area, and the bounce is a counter-trend move into a flat consolidation.
CHART PATTERNS
- Bullish Pennant / Flag (continuation): After the sharp rally from ~$43.5 to ~$47.4, price is coiling in a tight range ($46.4-$47.4) with narrowing Bollinger Bands. A breakout above ~$47.40 would project a move toward $47.8-$48.3.
- Failure case (Bearish Rising Wedge / lower-high structure): The rebound is a counter-trend bounce inside a larger downtrend, so a break below ~$46.70 and then $46.40 could reopen the move toward $45.5.
- No decisive pattern has confirmed yet. The bias rests on the squeeze resolving upward.
POTENTIAL SCENARIOS
- Scenario 1: Bullish Pennant Breakout — Price resolves the squeeze higher as CMF turns positive and +DI stays dominant. Trigger: close above the upper Bollinger Band / $47.41 on rising volume. Target: $47.80-$48.20. Invalidation: close below $46.40. (45% probability)
- Scenario 2: Neutral Range Digestion — Falling ADX and low volume keep price pinned between $46.60 and $47.40 until the 4 days are up. Trigger: repeated failures at both band edges. Target: $46.70-$47.10. Invalidation: a break outside the $46.40-$47.60 area. (30% probability)
- Scenario 3: Bearish Resumption of the Downtrend — The MACD bearish cross extends, EMA13 falls back through EMA34, and sellers defend the heavy overhead SMAs. Trigger: close below $46.69 and then $46.40. Target: $45.80-$46.00. Invalidation: reclaim of $47.00. (25% probability)
PRICE TARGETS
- Target Price: $47.20 (4-day)
- Expected Range: $45.95 to $47.95. Width is $2.00, about 4.3% of the current price, consistent with the 4-day guidance and roughly 5x ATR.
- Key Levels: Support at $46.40, Resistance at $47.45
OVERALL BIAS
OVERALL BIAS: BULLISH - Price is above the rising EMA34 and VWAP with +DI over −DI, CMF is turning positive, and the tight squeeze after a sharp rebound favors an upside resolution. Conviction is modest because the MACD has crossed down, ADX is fading, and the long-term trend remains bearish below the SMA50D and SMA200D.
This is educational analysis and not financial advice.