ARM 13-day bearish forecast — Nov 8, 2026
- Bias: Bearish
- Timeframe: 13 days (made Nov 8, 2026, target date Nov 20, 2026)
- Price at analysis: $174.53
- Price target: $168.50
- Expected range: $160.00 – $179.00
- Result: Pending — graded after the close on Nov 20, 2026
Get a free AI analysis of ARM today
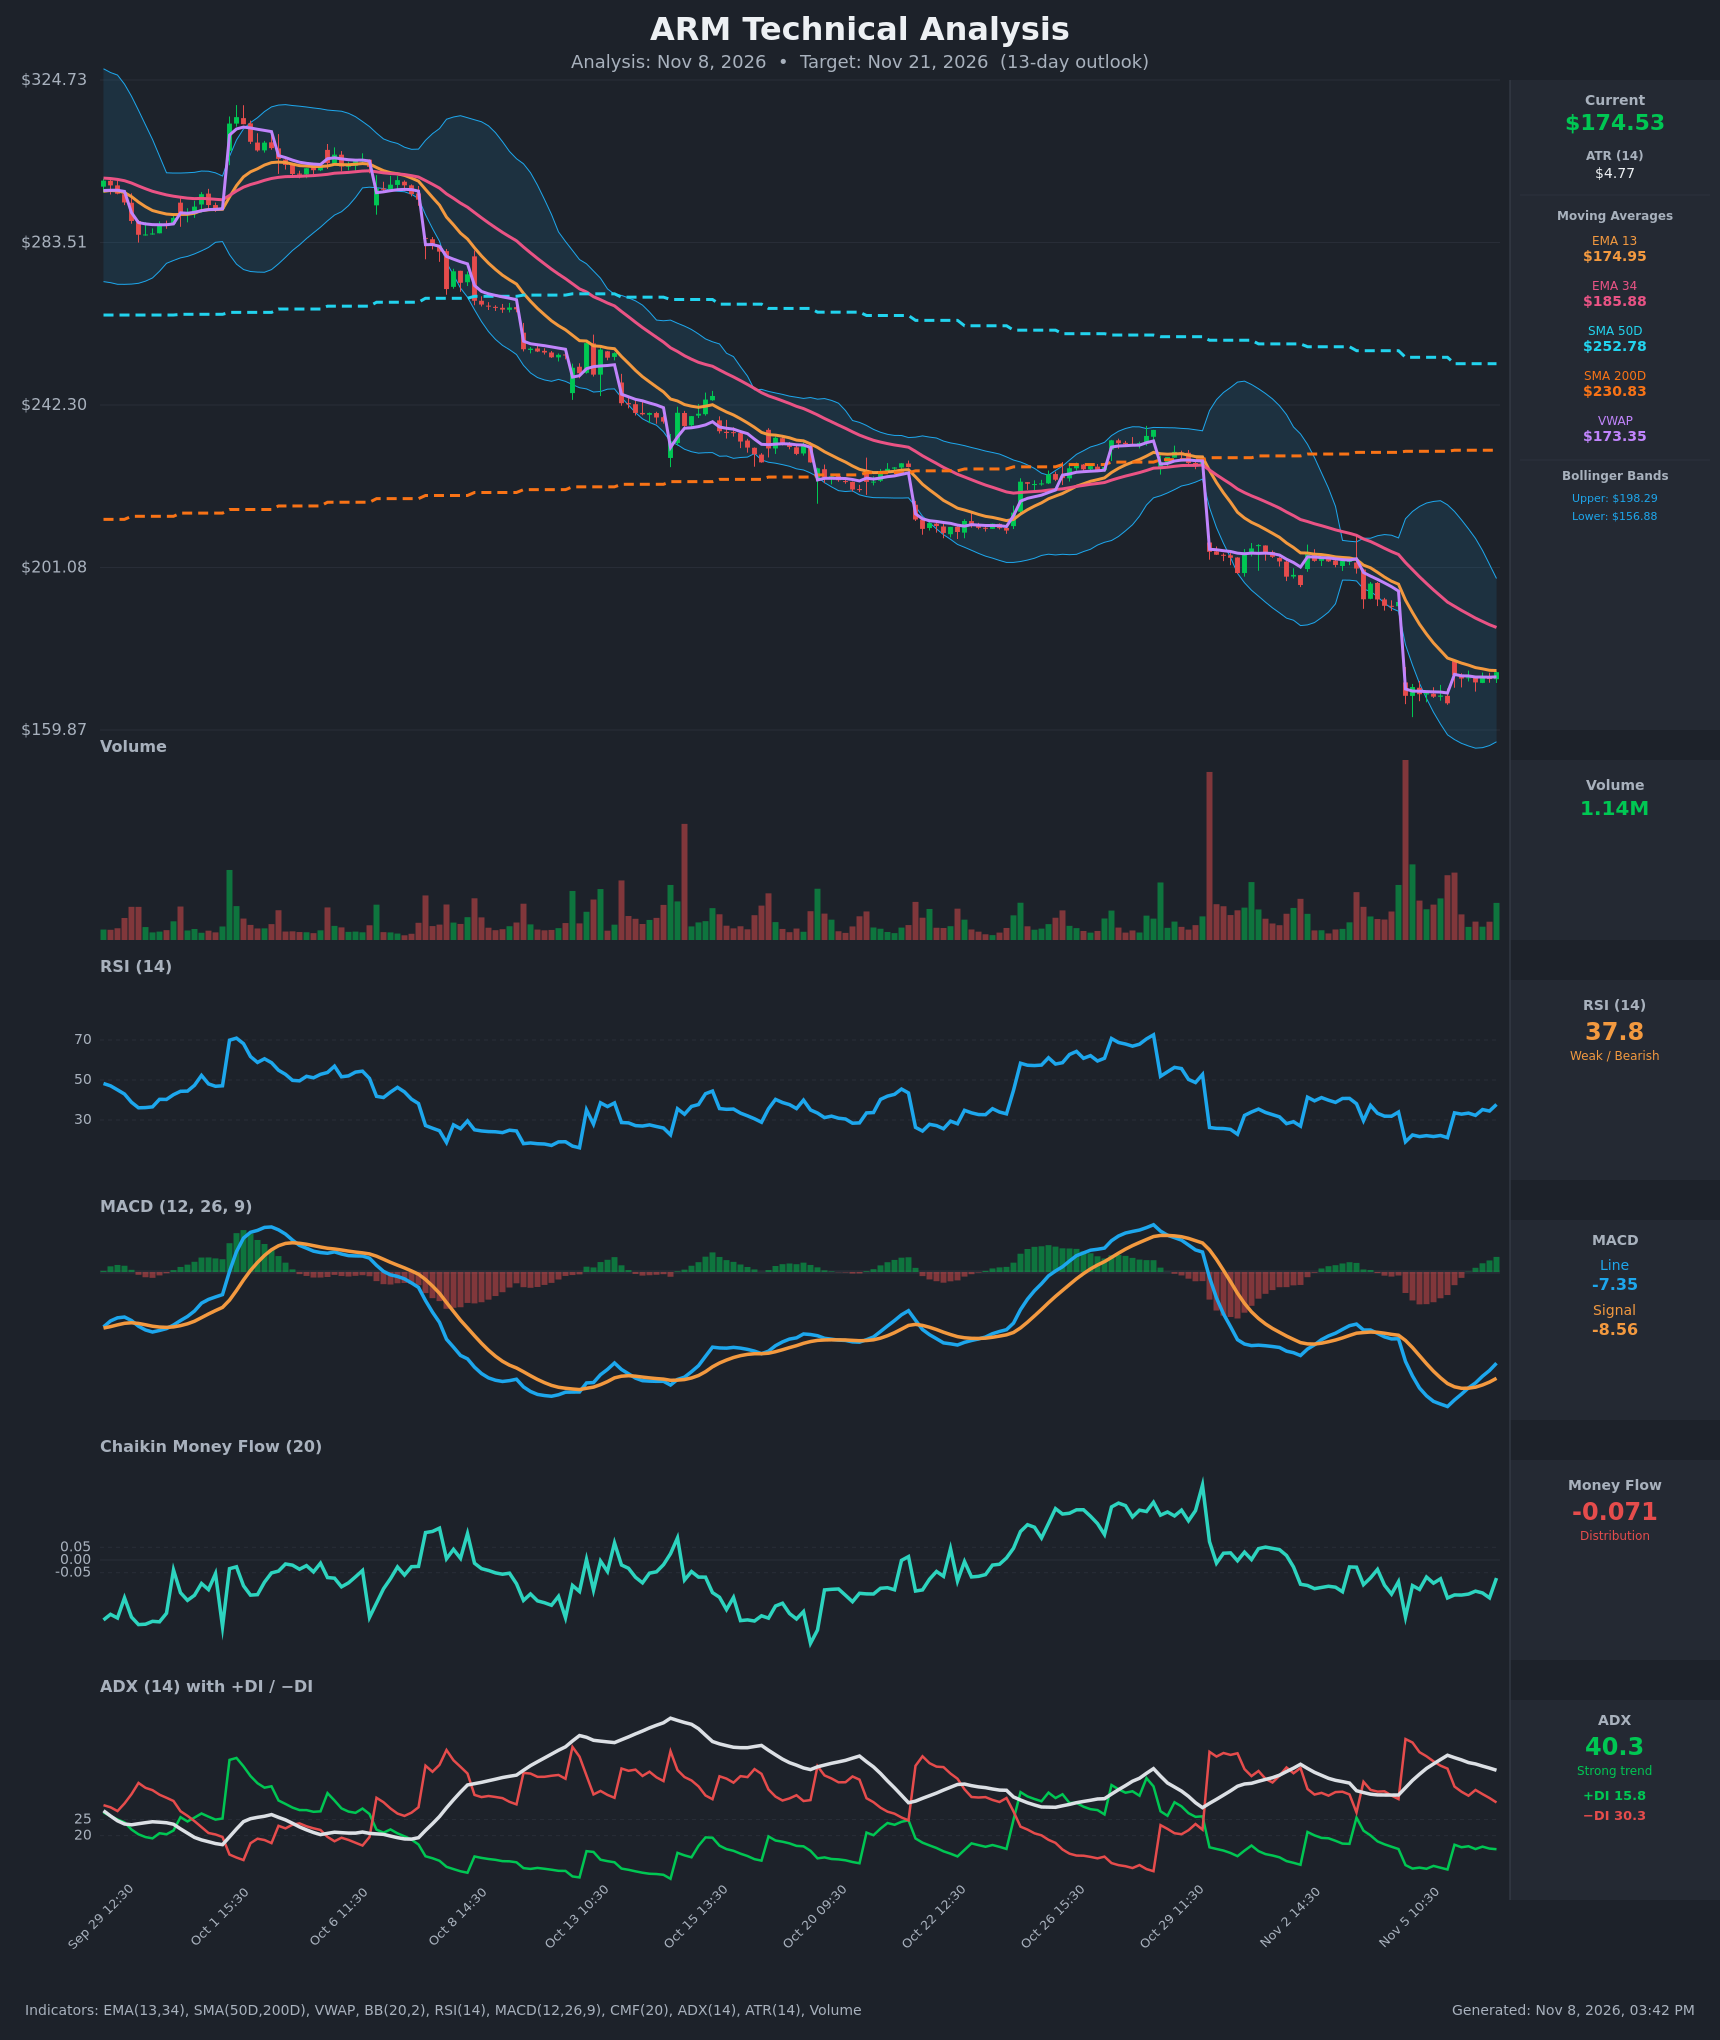
Analysis
TECHNICAL INDICATORS
- RSI (14): 37.78. It has recovered from deeply oversold readings near 19-22 on Nov 5 but is still below 50, so the bounce is a relief move inside a bearish regime. Momentum is rising but has not reclaimed the 40-50 zone, which acted as resistance throughout this downtrend. [Neutral]
- 20 EMA (EMA 13 / EMA 34 used): EMA 13 is $174.95 and price ($174.53) sits just beneath it, so it is acting as immediate resistance. EMA 34 is $185.88 and falling, and EMA 13 has been below EMA 34 since early November, a bearish stack. Both are sloping down. [Bearish]
- MACD: The line is -7.35 and the signal is -8.56. The line crossed above the signal around Nov 6 11:30 and the histogram has turned positive. This is a bullish momentum cross, but it happened deep below zero, which makes it a weak relief signal rather than a trend reversal. [Neutral]
- Bollinger Bands (20): The upper band is $198.29 and the lower is $156.88, so the midline is about $177.60. Price is below the midline after tagging or piercing the lower band on the gap-down, and the bands are wide from the volatility spike. Price is recovering toward the midline, which is likely resistance. [Bearish]
- CMF (20): -0.071, below -0.05. Money flow has been negative since the Oct 29 breakdown, with only brief attempts to recover, so distribution continues. [Distribution]
- ADX (14): 40.3 with −DI at 30.3 above +DI at 15.8. ADX is strong but slowly easing from a 45 peak. −DI has fallen from 50 and +DI has risen slightly, so selling pressure is cooling, but the bears still firmly control the trend. [Strong Trend – Bearish]
- Volume: 1.14M, light compared with the huge spike on the Nov 5 gap-down. The bounce is occurring on fading volume, which suggests weak conviction from buyers. Price is also in line with VWAP ($173.35), so there is no clear edge there. [Weak bounce / Bearish-leaning]
DIVERGENCES & TRENDS
- Price is below SMA 50 ($252.78) and SMA 200 ($230.83), a clear long-term downtrend. No death cross yet, but the SMA 50 has been rolling over toward the SMA 200.
- The chart shows a stair-step pattern of lower highs and lower lows. Each gap-down (Oct 29, Nov 5) is followed by sideways consolidation and then another leg lower.
- RSI recovered from about 21 to 38 while price recovered only from about $166.6 to $174.5, a modest relief move. It is not a true bullish divergence, since price is not making lower lows with higher RSI lows.
- A MACD bullish crossover below zero with a shrinking-bearish histogram suggests short-term upward momentum, but similar crossovers earlier (e.g. around Oct 8-13) fizzled below zero.
- Price is hovering at EMA 13 and VWAP, a pivotal short-term decision point. The −DI/+DI gap is still wide at about 15 points.
CHART PATTERNS
- The closest match from the reference diagram is a Bearish Flag / Pennant Pattern (continuation). Price gapped down sharply and is now consolidating in a tight range of roughly $166-$175. A breakdown below about $166 would project a measured move of roughly $150-$155.
- At a larger scale the chart shows a stair-step descending channel with a series of lower highs, consistent with a descending trend structure. The $198 upper band and the $185.88 EMA 34 form the descending resistance.
- Invalidation of the bearish structure would be a close above the EMA 34 at about $186, which would suggest a bullish reversal or a bounce within the downtrend.
POTENTIAL SCENARIOS
- Scenario 1: Bearish Flag Breakdown / Trend Continuation — The relief bounce stalls near the EMA 13 / BB midline (about $175-$178), and sellers push price back below the post-gap base. Trigger: failure at about $178 and a close below $166. Target: $160-$168, with an extension toward the $157 lower band. Invalidation: a daily close above $186. (50% probability)
- Scenario 2: Bullish Relief Rally — The bullish MACD cross and RSI recovery from oversold extend into a rebound toward the EMA 34 and the gap fill area. Trigger: a push above $178 (BB midline) on rising volume. Target: $185-$188, near the EMA 34. Invalidation: a drop back below $166. (33% probability)
- Scenario 3: Neutral Consolidation — Price stays pinned in the $166-$179 base as ADX cools from its peak. Trigger: no break of either boundary. Target: $170-$178. Invalidation: a close beyond $166 or $179. (17% probability)
PRICE TARGETS
- Target Price: $168.50 (13-day horizon, about 3.5% below current)
- Expected Range: $160.00 to $179.00 (width $19.00, about 10.9% of the $174.53 current price, consistent with the 8-12% guidance for 13-14 days)
- Key Levels: Support at $166.00, Resistance at $185.88
OVERALL BIAS
OVERALL BIAS: BEARISH - ADX at 40 with −DI well above +DI, price below all key moving averages, persistent CMF distribution, and a likely bear-flag consolidation on fading volume. The MACD crossover and RSI bounce are only relief signals below the falling EMA 34 and BB midline, so the bearish scenario carries the most evidence, though conviction is modest.
This is educational analysis and not financial advice.