GLD 13-day bullish forecast — Nov 8, 2026
- Bias: Bullish
- Timeframe: 13 days (made Nov 8, 2026, target date Nov 20, 2026)
- Price at analysis: $372.56
- Price target: $376.50
- Expected range: $358.00 – $388.00
- Result: Pending — graded after the close on Nov 20, 2026
Get a free AI analysis of GLD today
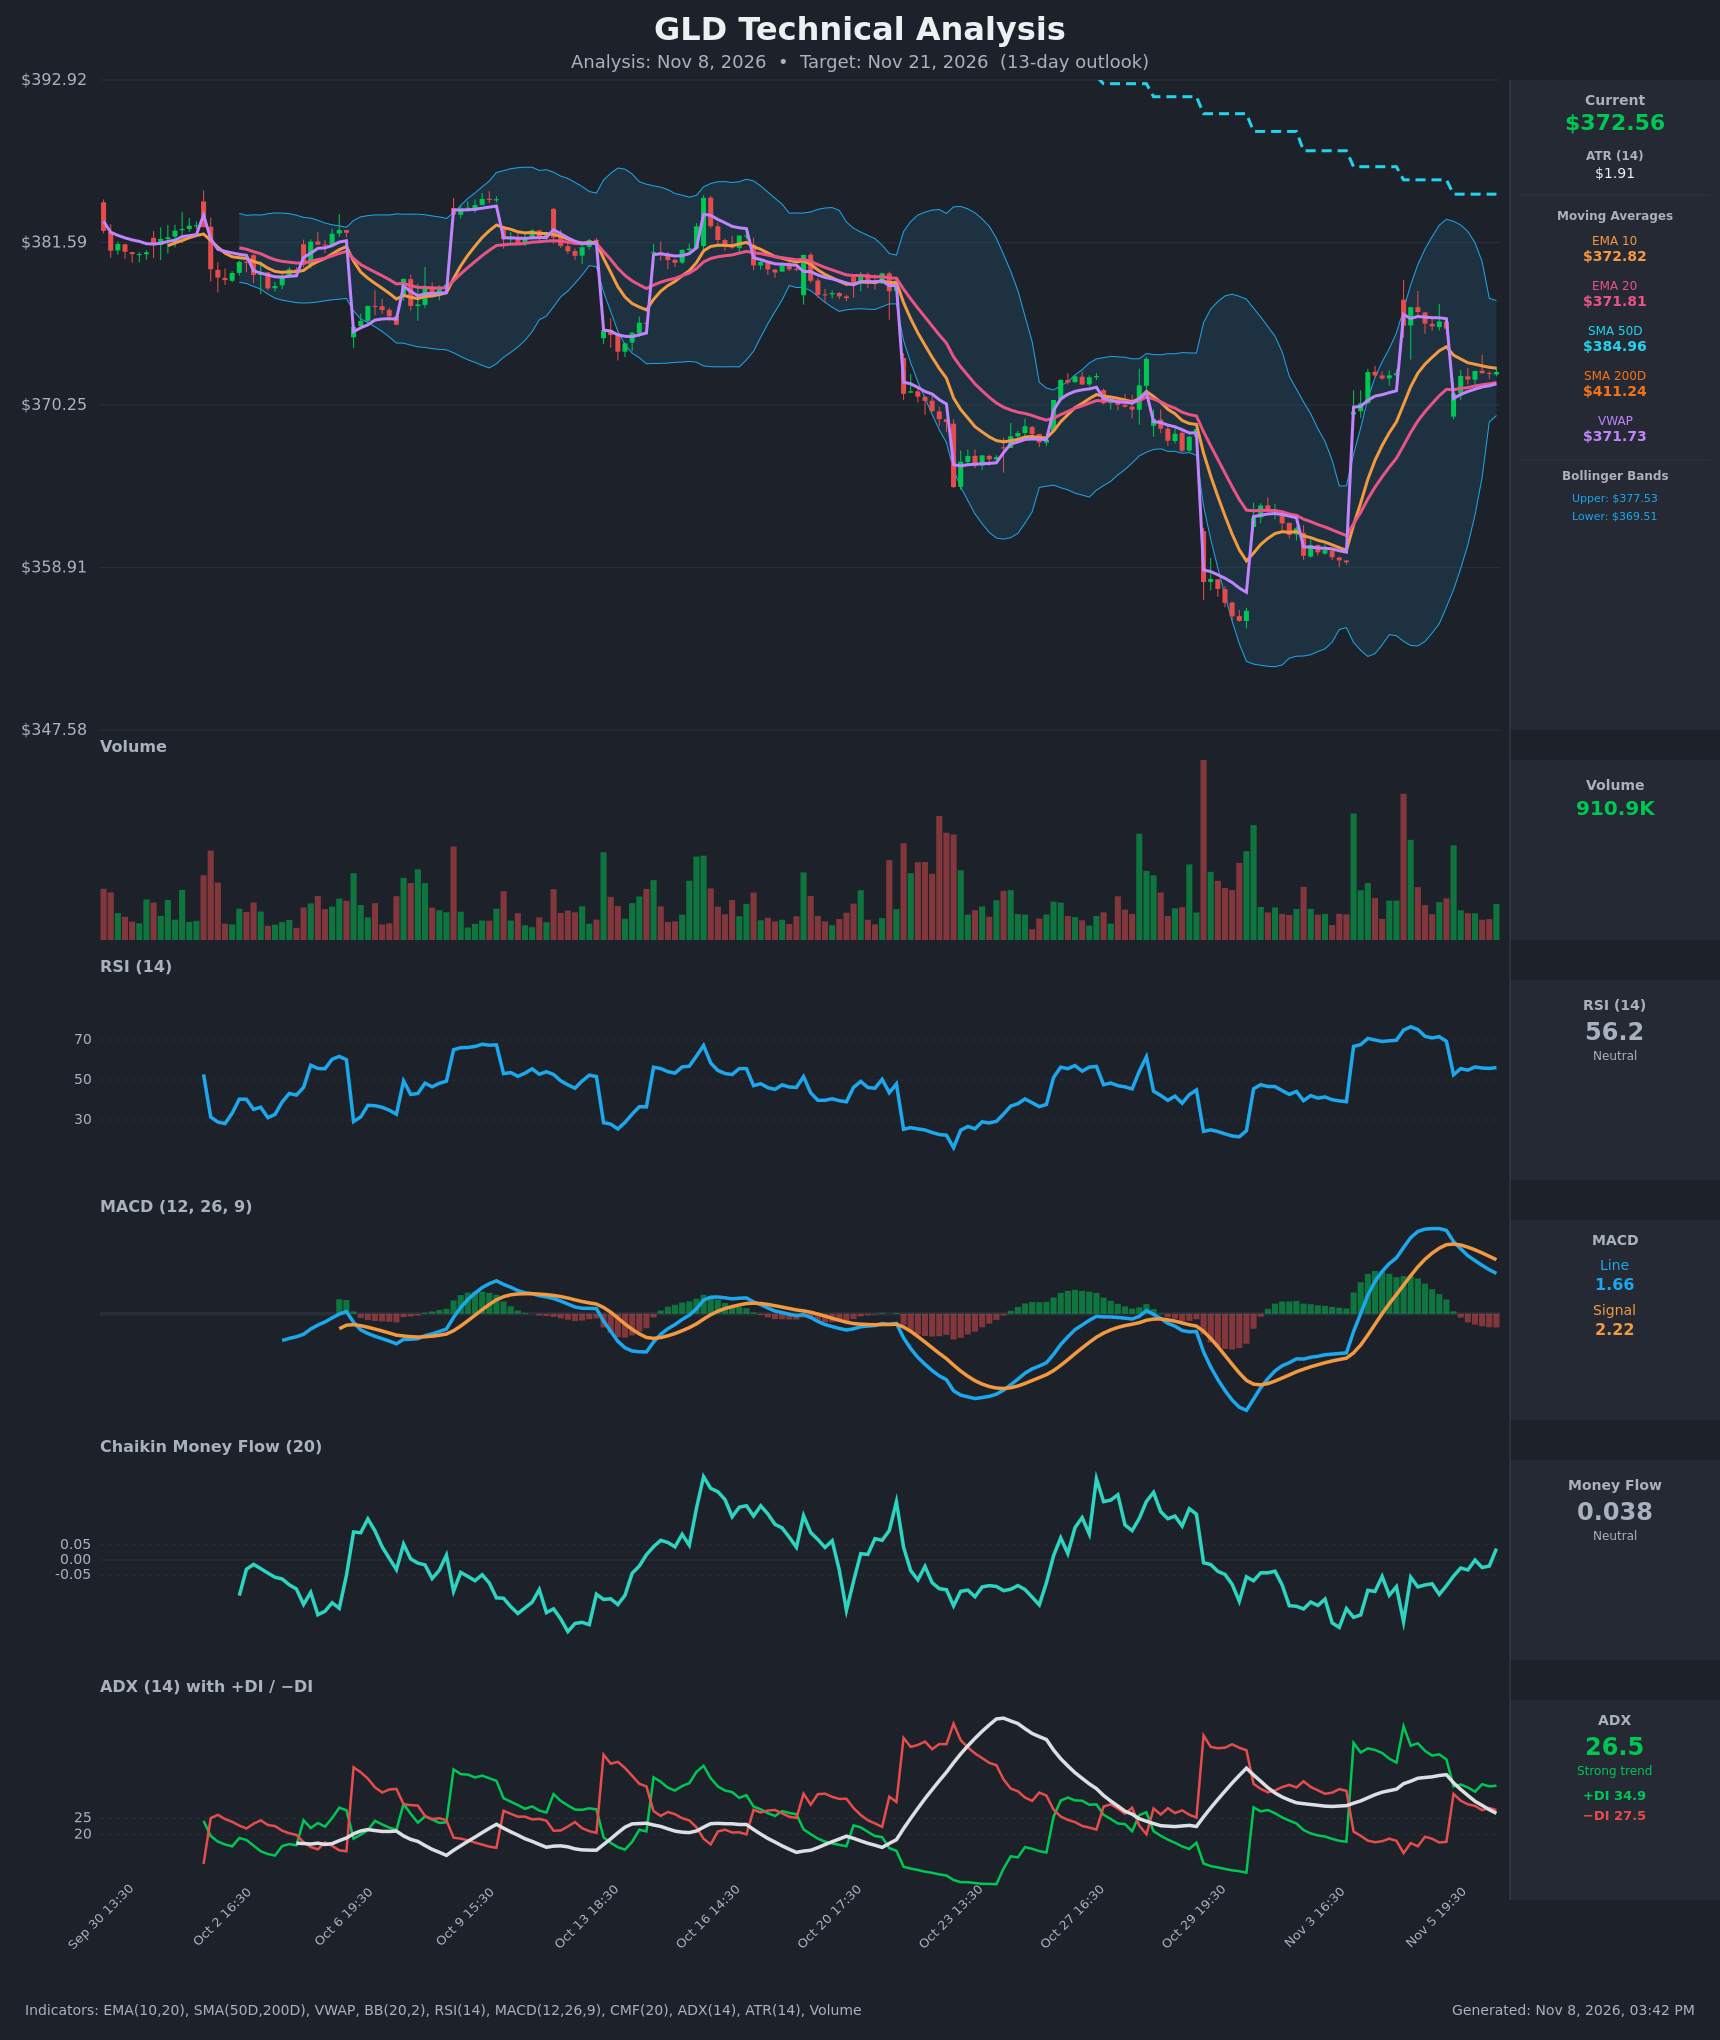
Analysis
TECHNICAL INDICATORS
- RSI (14): 56.2, down from an overbought peak of about 76.6 on Nov 5. It has settled back near the midline, and the flat 55-56 readings over the last several bars show momentum cooling but not breaking down. [Neutral]
- 20 EMA: $371.81, with price ($372.56) just above it. EMA10 ($372.82) is marginally above price and above EMA20, so the short-term cross remains positive. EMA20 is acting as first support. [Bullish]
- MACD: Line 1.66 is below Signal 2.22 (bearish crossover on Nov 6), the histogram is negative at about -0.56, and both lines are rolling over from the peak near 3.5. The decline in the line has slowed, but momentum is still negative. [Bearish]
- Bollinger Bands (20): Upper $377.53, lower $369.51, so price sits mid-band in the upper half. The bands are still wide after the volatile selloff and rebound, and they are starting to contract. This points to consolidation rather than a trending move. [Neutral]
- CMF (20): 0.038, having just crossed from slightly negative to slightly positive. It is still inside the ±0.05 neutral zone, so it is an early sign of improving buying pressure but not confirmed accumulation. [Neutral]
- ADX (14): 26.5 and falling from 38. +DI (34.9) is above −DI (27.5), but the spread has narrowed sharply from 43 vs 14, so the post-rally trend is fading. [Strong but weakening trend, bullish DI]
- Volume: 910.9K, in line with or below recent averages. The spike days came during the selloff and the sharp rebound, and the recent sideways bars are on lighter volume. That is typical of consolidation, not distribution. [Neutral - consolidating]
Moving averages and VWAP:
- Price vs SMAs: Price is far below SMA50 ($384.96) and SMA200 ($411.24). SMA50 is well below SMA200, a death-cross structure that confirms a long-term downtrend. [Bearish]
- VWAP: $371.73, with price just above it, which suggests slight buyer control intraday. [Mildly Bullish]
DIVERGENCES & TRENDS
- There is no clear divergence. RSI came off its 76 peak as price stalled near $377, which is a normal cooling rather than a bearish divergence.
- MACD has crossed below its signal line, a bearish short-term shift. Price has not followed through, since the pullback has held above EMA20 and VWAP.
- ADX is falling while +DI and −DI converge. A DI crossover is possible if price slips below $371, and a bearish DI cross would add weight to the downside case.
- CMF has improved from deeply negative readings during the selloff to slightly positive, a mild bullish trend change.
- The long-term trend is still down: SMA50 and SMA200 are both sloping lower, and rallies have been sold near the SMA50 area (~$385).
CHART PATTERNS
- Bullish Flag / Pennant (continuation): After the sharp V-shaped rebound from about $352 to $377, price is consolidating in a tight $370-377 range on lighter volume. A breakout above $377.5 would target the flagpole projection and likely stall near the SMA50 at about $385.
- Reversal context: The V-bottom from $352 resembles a Bullish Double Bottom or Falling Wedge reversal in the broader picture. It is not confirmed, because price is still below the SMAs.
- Risk to the pattern: A close below $369.5 invalidates the flag and would open a retest of the $360 area.
POTENTIAL SCENARIOS
- Scenario 1: Bullish Flag Breakout — Consolidation holds above EMA20 and VWAP, MACD flattens and turns up, CMF moves above +0.05, and price breaks the range top. Trigger: close above $377.50 on rising volume. Target: $381-385 (SMA50 zone). Invalidation: close below $369.50. (45% probability)
- Scenario 2: Bearish Rollover Within the Downtrend — The negative MACD cross and falling ADX lead to a failed bounce below the SMA50 and SMA200. Price loses EMA20 and VWAP and the DIs cross bearish. Trigger: close below $369.50. Target: $362-358. Invalidation: reclaim of $374 with strong volume. (35% probability)
- Scenario 3: Neutral Range Chop — Price oscillates between $369.5 and $377.5 with fading ADX and tightening bands. Trigger: no close outside the band range. Target: $371-376. Invalidation: close outside the $369.5-$377.5 range. (20% probability)
PRICE TARGETS
- Target Price: $376.50 (13-day horizon)
- Expected Range: $358.00 to $388.00 (width $30.00, about 8.1% of current price, consistent with the 13-day timeframe)
- Key Levels: Support at $369.51 (lower Bollinger Band; EMA20/VWAP at about $371.8 sit just beneath price), Resistance at $377.53 (upper Bollinger Band and recent high; SMA50 at $384.96 above)
OVERALL BIAS
OVERALL BIAS: BULLISH - Price is holding above EMA20 and VWAP in a tight flag after a sharp rebound, with +DI above −DI and CMF turning positive. The case is modest, because the bearish MACD cross and the position below the SMA50 and SMA200 cap the upside near $385.
This is educational analysis and not financial advice.