MSTR 13-day bearish forecast — Nov 8, 2026
- Bias: Bearish
- Timeframe: 13 days (made Nov 8, 2026, target date Nov 20, 2026)
- Price at analysis: $128.95
- Price target: $125.00
- Expected range: $116.50 – $133.50
- Result: Pending — graded after the close on Nov 20, 2026
Get a free AI analysis of MSTR today
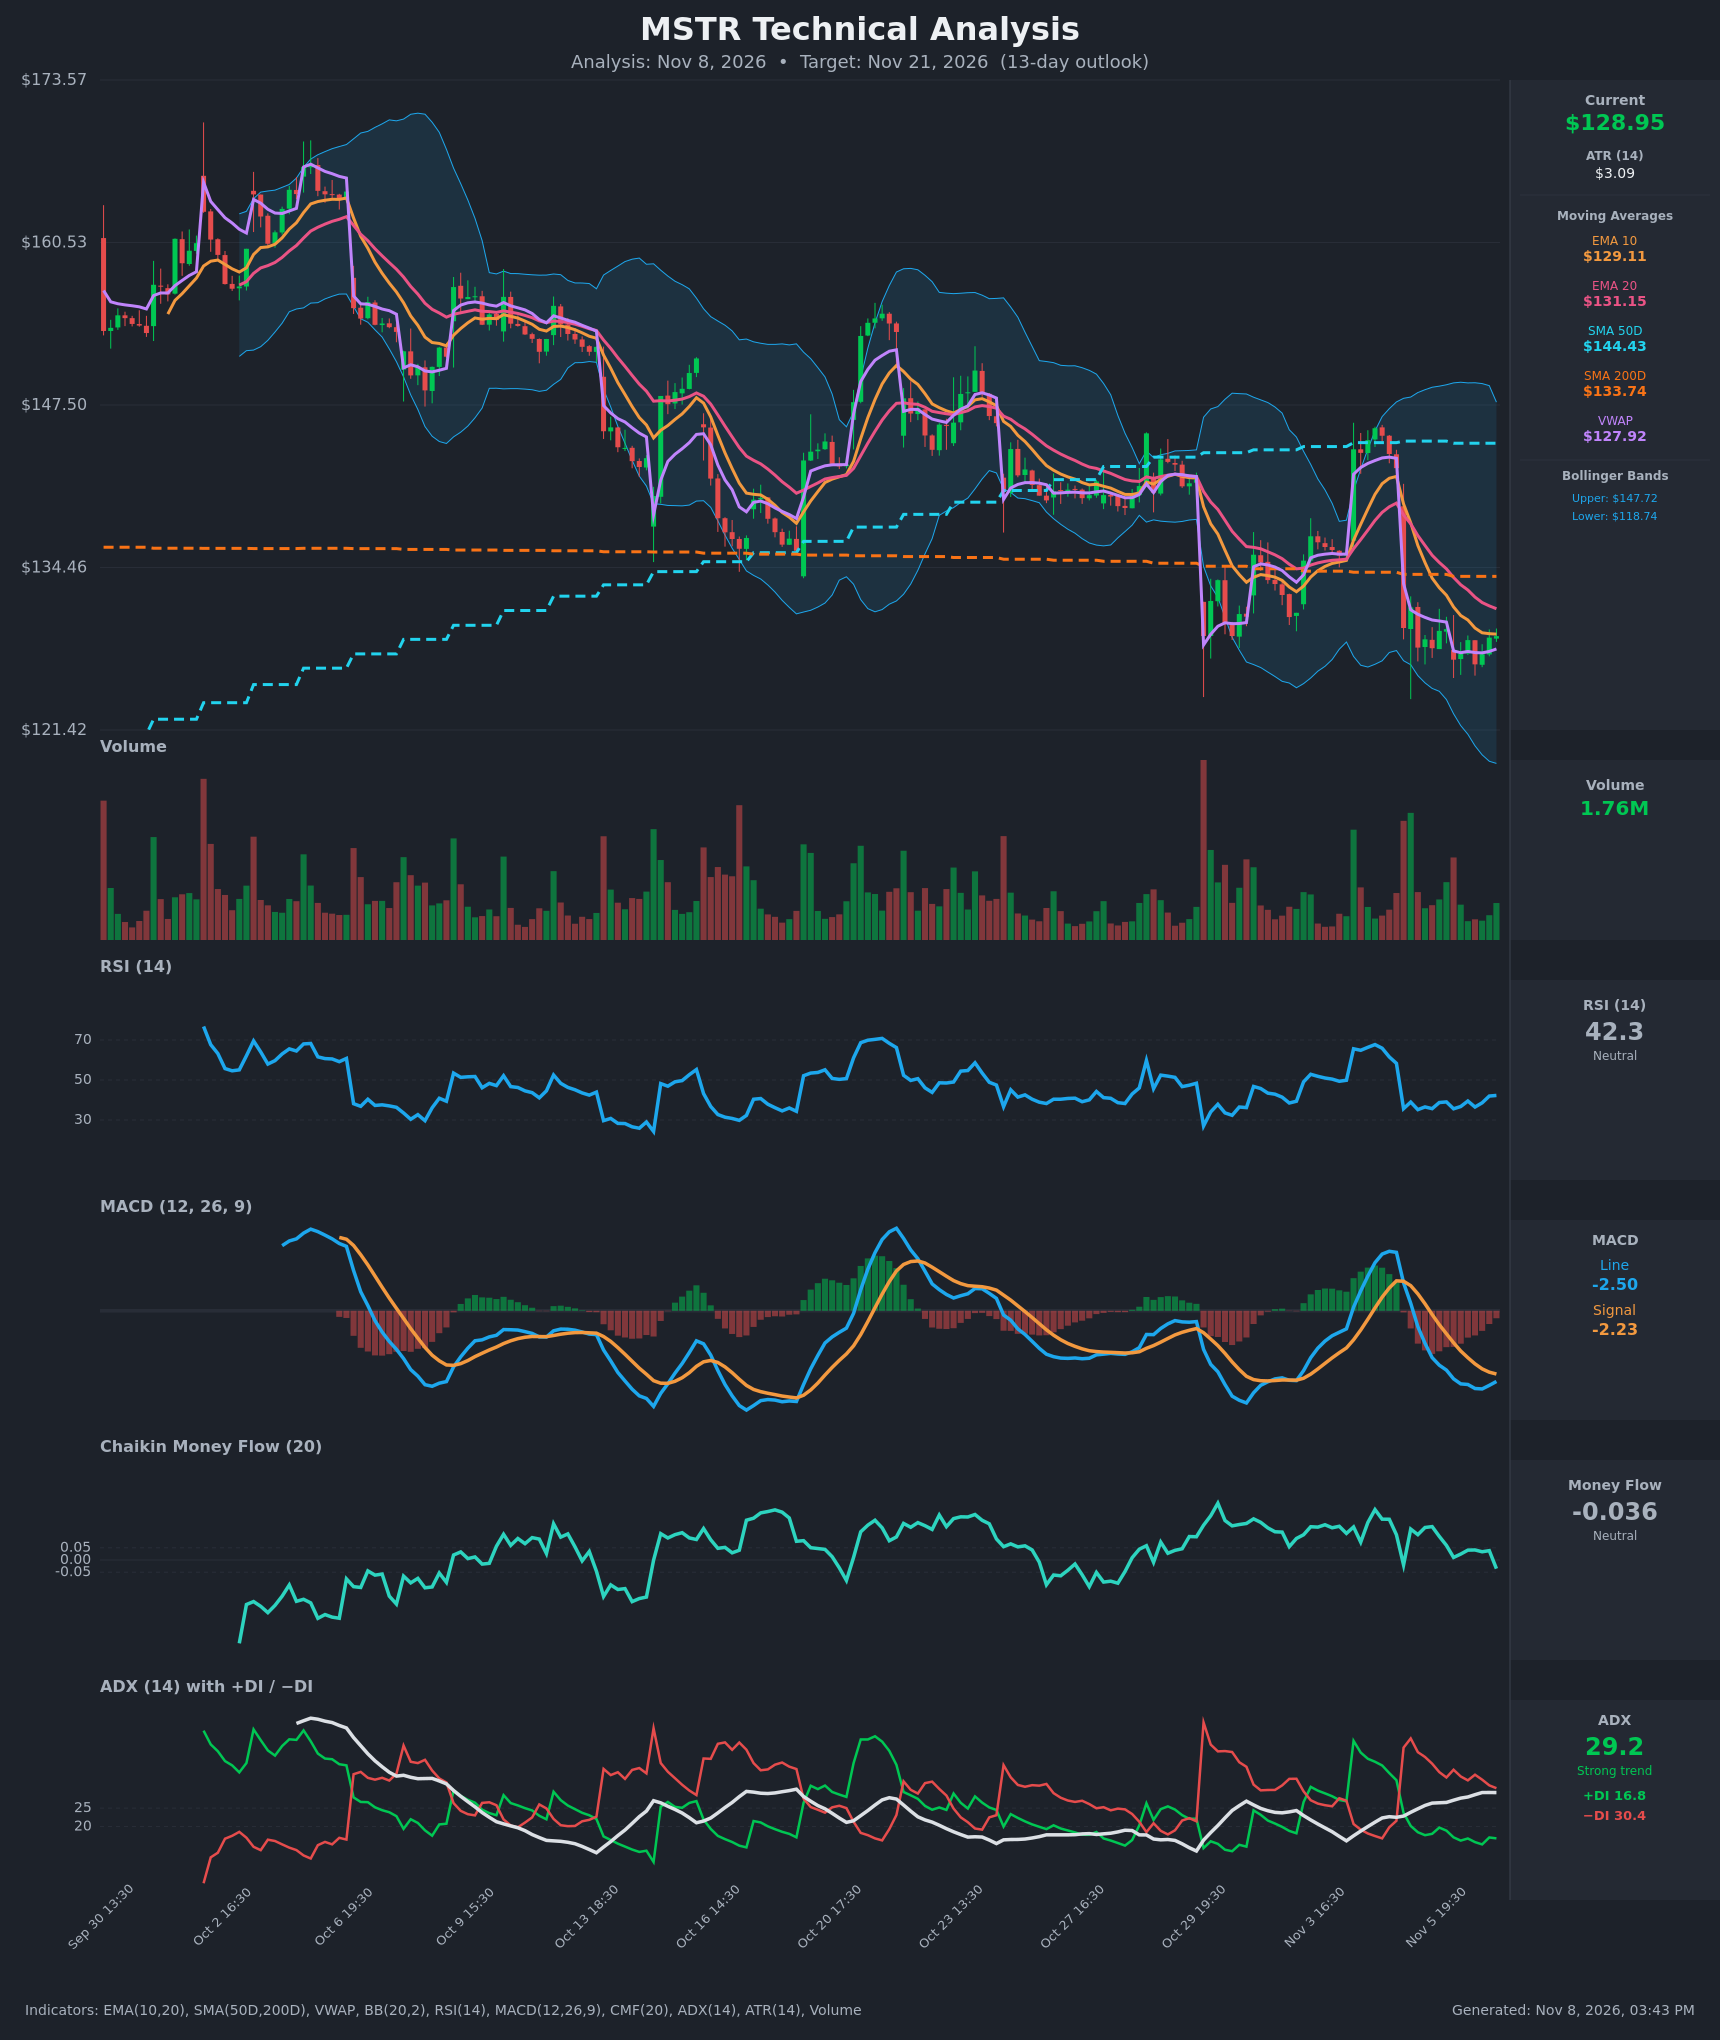
Analysis
TECHNICAL INDICATORS
- RSI (14): 42.28, up from the 35–36 lows of the last two sessions but still below 50. It sits in the lower-neutral zone and has not reached oversold. The bounce is a mild momentum improvement inside a downtrend. [Neutral]
- 20 EMA: $131.15, with price at $128.95 below it. The EMA10 ($129.11) is also below the EMA20, a bearish cross that happened around Nov 5, and price is pinned right at the EMA10. The EMA20 is overhead resistance. [Bearish]
- MACD: Line -2.50 is below signal -2.23, and both are negative. The histogram is slightly negative but narrowing, as the line turned up from -2.76. A bullish crossover is possible but has not happened. The bearish crossover from Nov 5 is still in force. [Bearish]
- Bollinger Bands (20): Upper $147.72, lower $118.74, midline about $133.2. Price is in the lower half of the bands, about 1/3 of the way up from the lower band. The bands are wide after the volatile drop, so there is room in both directions. Price is below the midline, which is bearish. [Bearish]
- CMF (20): -0.036, just inside the neutral zone. It has faded from +0.13 and just turned negative on the last bar. Buying pressure is evaporating, but it is not yet clear distribution. [Neutral]
- ADX (14): 29.2 and rising, so the trend is strong. −DI 30.4 is far above +DI 16.8, so bears are in control. The −DI/+DI gap is narrowing slightly, which hints at fading selling pressure. [Strong Trend – Bearish]
- Volume: 1.76M, light compared with the heavy-volume gap-down days. The recent consolidation around $127–129 is on declining volume. This looks like a pause after the drop, not capitulation or accumulation. [Neutral – consolidation after selloff]
DIVERGENCES & TRENDS
- The price made lower lows from Nov 5 through Nov 6 ($127.98, $127.06, $126.69), while RSI made slightly higher lows (35.2 to 35.6 to 36.5). This is a minor bullish divergence, and it is short-term only.
- MACD's line has flattened and is curling up. A bullish cross is possible within a few bars if price holds, but it would occur below zero, so it would be only a relief signal.
- VWAP is $127.92, and price is holding just above it. That gives short-term support and shows the bounce has been absorbed.
- The EMA10 is flattening against price, and the EMA20 is declining. Price is trapped between them.
- The SMA50D ($144.43) is above the SMA200D ($133.74), so there is no death cross, but price is below both. Price is at the SMA200D from below, which is now resistance at $133.74. The SMA50D is far overhead.
- ADX has risen from about 22 to 29 as price fell, so the downtrend has gained strength. CMF drifting from +0.13 to -0.036 confirms the weakening of buyers.
- The broader chart shows a series of lower highs since early October (about $165, $150, $146, $142), a clear downtrend.
CHART PATTERNS
- Descending channel / lower highs: The sequence of lower highs and gap-downs resembles a bearish continuation structure on the daily scale. Each rally (Oct 20, Nov 3) failed below $147–150.
- Small base / pennant-like consolidation at $126.7–129.6: The last ~8 bars show tight price action after the Nov 5 gap-down. This resembles a Bearish Pennant / Flag (continuation lower). A break below $126.5 targets roughly the flagpole height projection, about $118 to $120 (near the lower Bollinger Band). The measured move from $142 to $129 is about $13, which projects to about $114–116 on a full measure.
- Counter-case: The minor RSI divergence and the narrow range could form a short-term Bullish Double Bottom near $127. A break above $131–132 (EMA20) would target the SMA200D at $133.74 and the BB midline around $133.
POTENTIAL SCENARIOS
- Scenario 1: Bearish Pennant Breakdown — Price fails at the EMA20/SMA200D zone, breaks below the $126.5 consolidation low and VWAP, and continues the downtrend with ADX above 25 and −DI dominant. Trigger: close below $126.50 on rising volume. Target: $120–$122, with the lower BB near $118.74 as an extension. Invalidation: daily close above $134. (50% probability)
- Scenario 2: Bullish Relief Bounce — The RSI divergence and a MACD bullish cross spark a rebound toward the EMA20 and SMA200D, then price stalls. Trigger: break above $131.15 (EMA20) with volume. Target: $133.70–$136. Invalidation: close below $126.50. (28% probability)
- Scenario 3: Neutral Range Chop — Price stays between $125 and $132 as the volatility compresses and the market digests the recent drop. Trigger: failure of both the break below $126.5 and the break above $131.2. Target: $127–$130. Invalidation: a decisive close outside $124–$134. (22% probability)
PRICE TARGETS
- Target Price: $125.00 (13-day)
- Expected Range: $116.50 to $133.50. The width is $17.00, about 13.2% of the current price, which fits the 13-day guidance (8–12% for 14–21 days, slightly wider here to reflect ATR and the elevated volatility of this stock).
- Key Levels: Support at $126.50 (recent consolidation low; below that, $118.74 lower BB), Resistance at $131.15 (EMA20; then $133.74 SMA200D)
OVERALL BIAS
OVERALL BIAS: BEARISH - Price is below the EMA10 and EMA20, MACD is below its signal, −DI at 30.4 is far above +DI at 16.8 with ADX rising to 29.2, and CMF has slipped negative. The tight consolidation at $127–129 looks like a bearish pennant. The minor RSI divergence only suggests a relief bounce into $131–134 resistance before further downside.
This is educational analysis and not financial advice.