NIO 13-day bullish forecast — Nov 8, 2026
- Bias: Bullish
- Timeframe: 13 days (made Nov 8, 2026, target date Nov 20, 2026)
- Price at analysis: $3.40
- Price target: $3.50
- Expected range: $3.28 – $3.62
- Result: Pending — graded after the close on Nov 20, 2026
Get a free AI analysis of NIO today
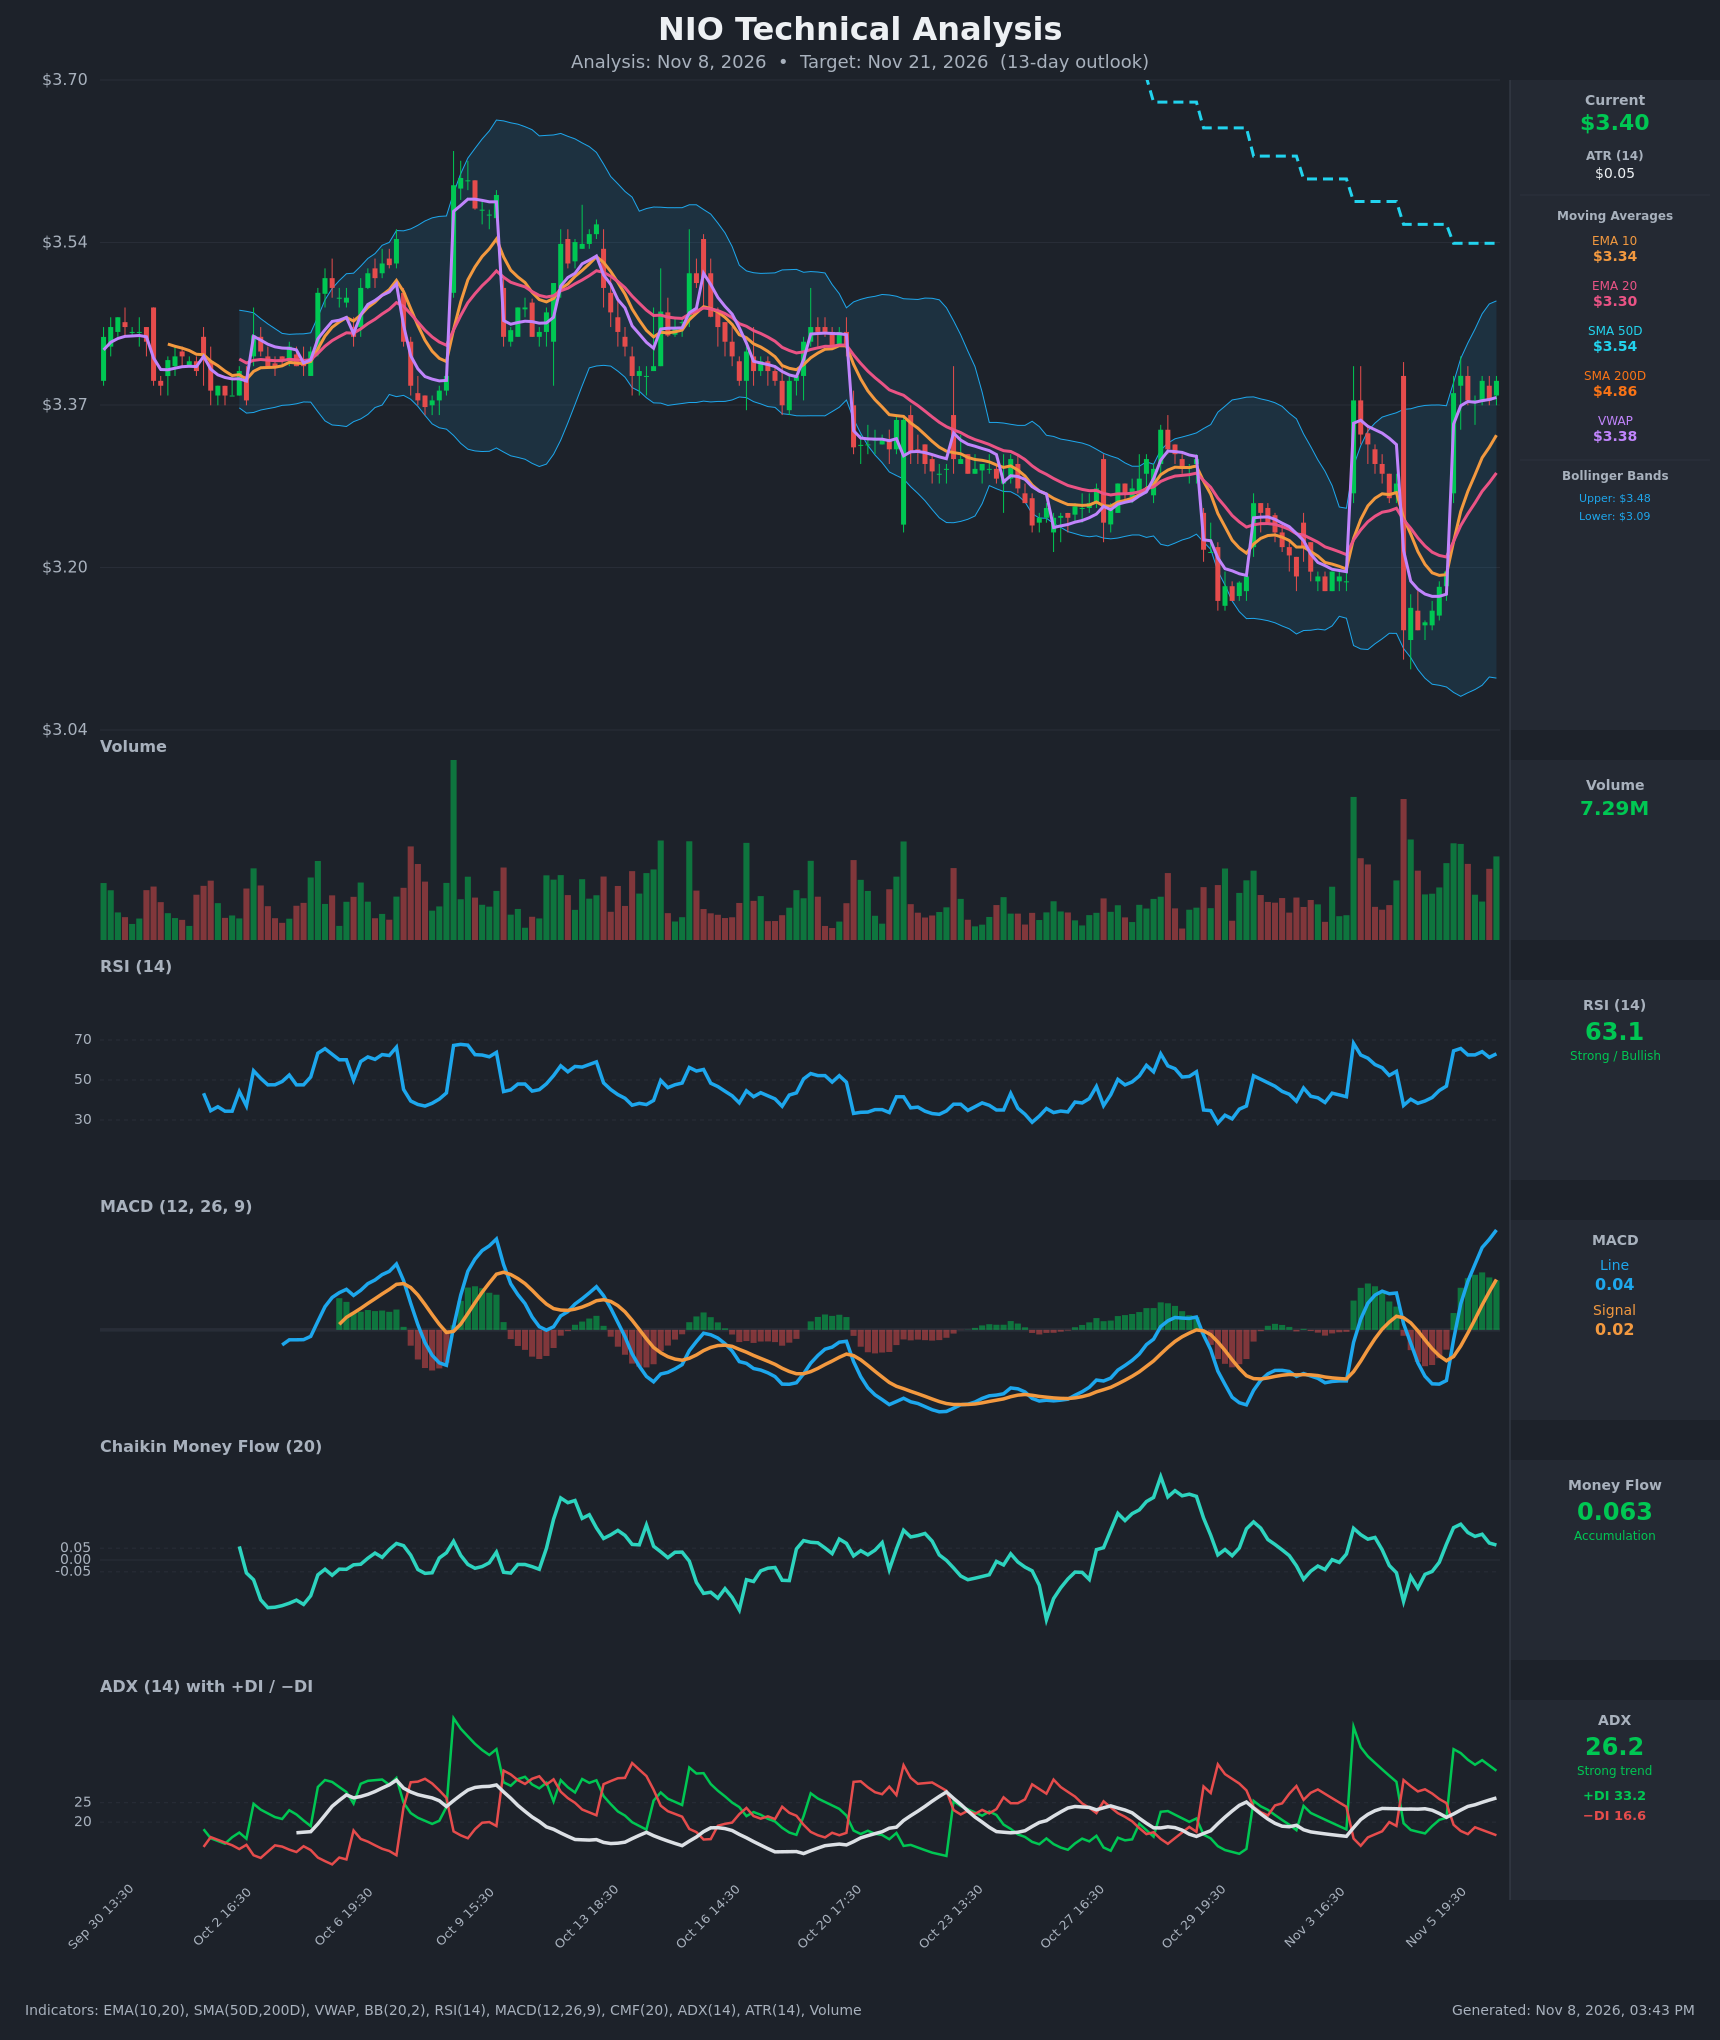
Analysis
TECHNICAL INDICATORS
- RSI (14): 63.08. It is in the upper-neutral/strong zone and below the 70 overbought line. It has recovered sharply from about 37 on Nov 5 and has held 61-66 for the last session, so momentum is firm with some room left. [Bullish]
- 20 EMA: $3.3008. Price at $3.395 is about 2.9% above it. EMA10 ($3.3394) crossed above EMA20 during the Nov 6 session, so the short-term averages are aligned upward and the EMAs are acting as dynamic support. [Bullish]
- MACD: Line 0.0388 versus signal 0.0196, a histogram of about +0.019 that is still widening. The bullish crossover occurred on Nov 6 (around the 15:30 bar) and the line is rising steeply, though it remains near the zero line. [Bullish]
- Bollinger Bands (20): Upper $3.4767, lower $3.0911, so the middle band is about $3.28. Price sits in the upper third of the band after bouncing from the lower band. The bands are starting to widen, but the upper band is close and may cap the first push. [Bullish]
- CMF (20): 0.063. It is just above the +0.05 accumulation threshold, up from -0.175 on Nov 5, so buying pressure has returned. It is only marginally above the threshold, so conviction is modest. [Accumulation]
- ADX (14): 26.2 and rising, with +DI 33.2 above −DI 16.6. The +DI/−DI crossover on Nov 6 flipped control to the bulls, and ADX has moved above 25 to confirm a trend. [Strong Trend + Bullish]
- Volume: 7.29M. Volume was heavy on the Nov 6 gap-up and the recovery bars were mostly green, which supports the bounce. Volume has been fading slightly over the last few bars, so follow-through needs fresh buying. [Moderately Supportive of Upside]
Other levels and moving averages:
- VWAP: $3.378, with price just above it, which shows intraday buyers in control.
- SMA50D: $3.5356, about 4% overhead and acting as resistance.
- SMA200D: $4.8636, far above price, so the long-term trend is still down.
- Death cross: SMA50D is below SMA200D, a long-standing bearish backdrop.
DIVERGENCES & TRENDS
- There is no clear price/indicator divergence. The higher RSI, MACD and CMF readings are confirmed by price recovering from the $3.10 low.
- The rally from Nov 5 to Nov 6 shows a trend shift in the short-term indicators. RSI went from 37 to 63, MACD crossed up, +DI crossed above −DI and CMF turned positive.
- This is a short-term recovery inside a larger downtrend. Price is still below the SMA50D ($3.54) and well below the SMA200D ($4.86), so overhead resistance is significant.
- The MACD is still close to the zero line, so the bullish momentum is early-stage and not yet extended.
- Price is approaching the upper Bollinger Band ($3.48). A pause or minor pullback is plausible before any further advance.
CHART PATTERNS
- Bullish Falling Wedge: The lower highs and lower lows from mid-October through early November (the low near $3.10) resolved upward with the Nov 6 gap and breakout. The classic target is a retracement toward the wedge's origin, roughly $3.54-$3.60, which is in line with the SMA50D and the Oct 9 high area.
- Bullish Double Bottom (loose): The lows around $3.10-$3.14 on Nov 5 echo earlier lows, and price has cleared the intervening neckline near $3.38-$3.40. A measured move points to about $3.60-$3.65, but the pattern is not a textbook match.
- Confirmation requires a sustained close above the $3.48 upper Bollinger Band and the $3.54 SMA50D. Failure to hold above $3.34 (EMA10) would weaken both patterns.
POTENTIAL SCENARIOS
- Scenario 1: Bullish Wedge Breakout Follow-Through — Price keeps building on the gap-up with positive MACD, +DI dominance and accumulation. It tests the upper Bollinger Band and then the SMA50D. Trigger: a close above $3.48 on rising volume. Target: $3.50-$3.60. Invalidation: a close below $3.30 (EMA20) that negates the breakout. (50% probability)
- Scenario 2: Bearish Rejection at Resistance — Price stalls at the upper Bollinger Band and the SMA50D, which sit in a long-term downtrend below the SMA200D. The Nov 6 gap fills as sellers return. Trigger: a rejection near $3.48-$3.54 and a break below the VWAP ($3.38) and EMA10 ($3.34). Target: $3.20-$3.30. Invalidation: a close above $3.55. (30% probability)
- Scenario 3: Neutral Consolidation — Price digests the gap in a range between EMA10 support and the upper band while the indicators cool. Trigger: a flat ADX and RSI drifting back to 50-55. Target: $3.33-$3.48. Invalidation: a break above $3.54 or below $3.28. (20% probability)
PRICE TARGETS
- Target Price: $3.50 (13-day horizon)
- Expected Range: $3.28 to $3.62 (width $0.34, about 10% of the current price)
- Key Levels: Support at $3.30, Resistance at $3.54
Self-check: a 13-day range of about 10% of price fits the 7-14 day guidance (roughly 4-12%) and is well above a 2-3 day range. The $3.50 target is above the $3.395 price, consistent with a bullish bias.
OVERALL BIAS
OVERALL BIAS: BULLISH - A fresh MACD bullish crossover, a +DI/−DI flip with ADX above 25, returning CMF accumulation, and price above the VWAP and rising EMAs, together with a falling-wedge breakout, favor a move toward $3.50. Conviction is moderate because the upper Bollinger Band, the SMA50D at $3.54 and the long-term downtrend below the SMA200D limit the upside.
This is educational analysis and not financial advice.