MARA 13-day bearish forecast — Nov 8, 2026
- Bias: Bearish
- Timeframe: 13 days (made Nov 8, 2026, target date Nov 20, 2026)
- Price at analysis: $6.34
- Price target: $6.10
- Expected range: $5.75 – $6.45
- Result: Pending — graded after the close on Nov 20, 2026
Get a free AI analysis of MARA today
Analysis
TECHNICAL INDICATORS
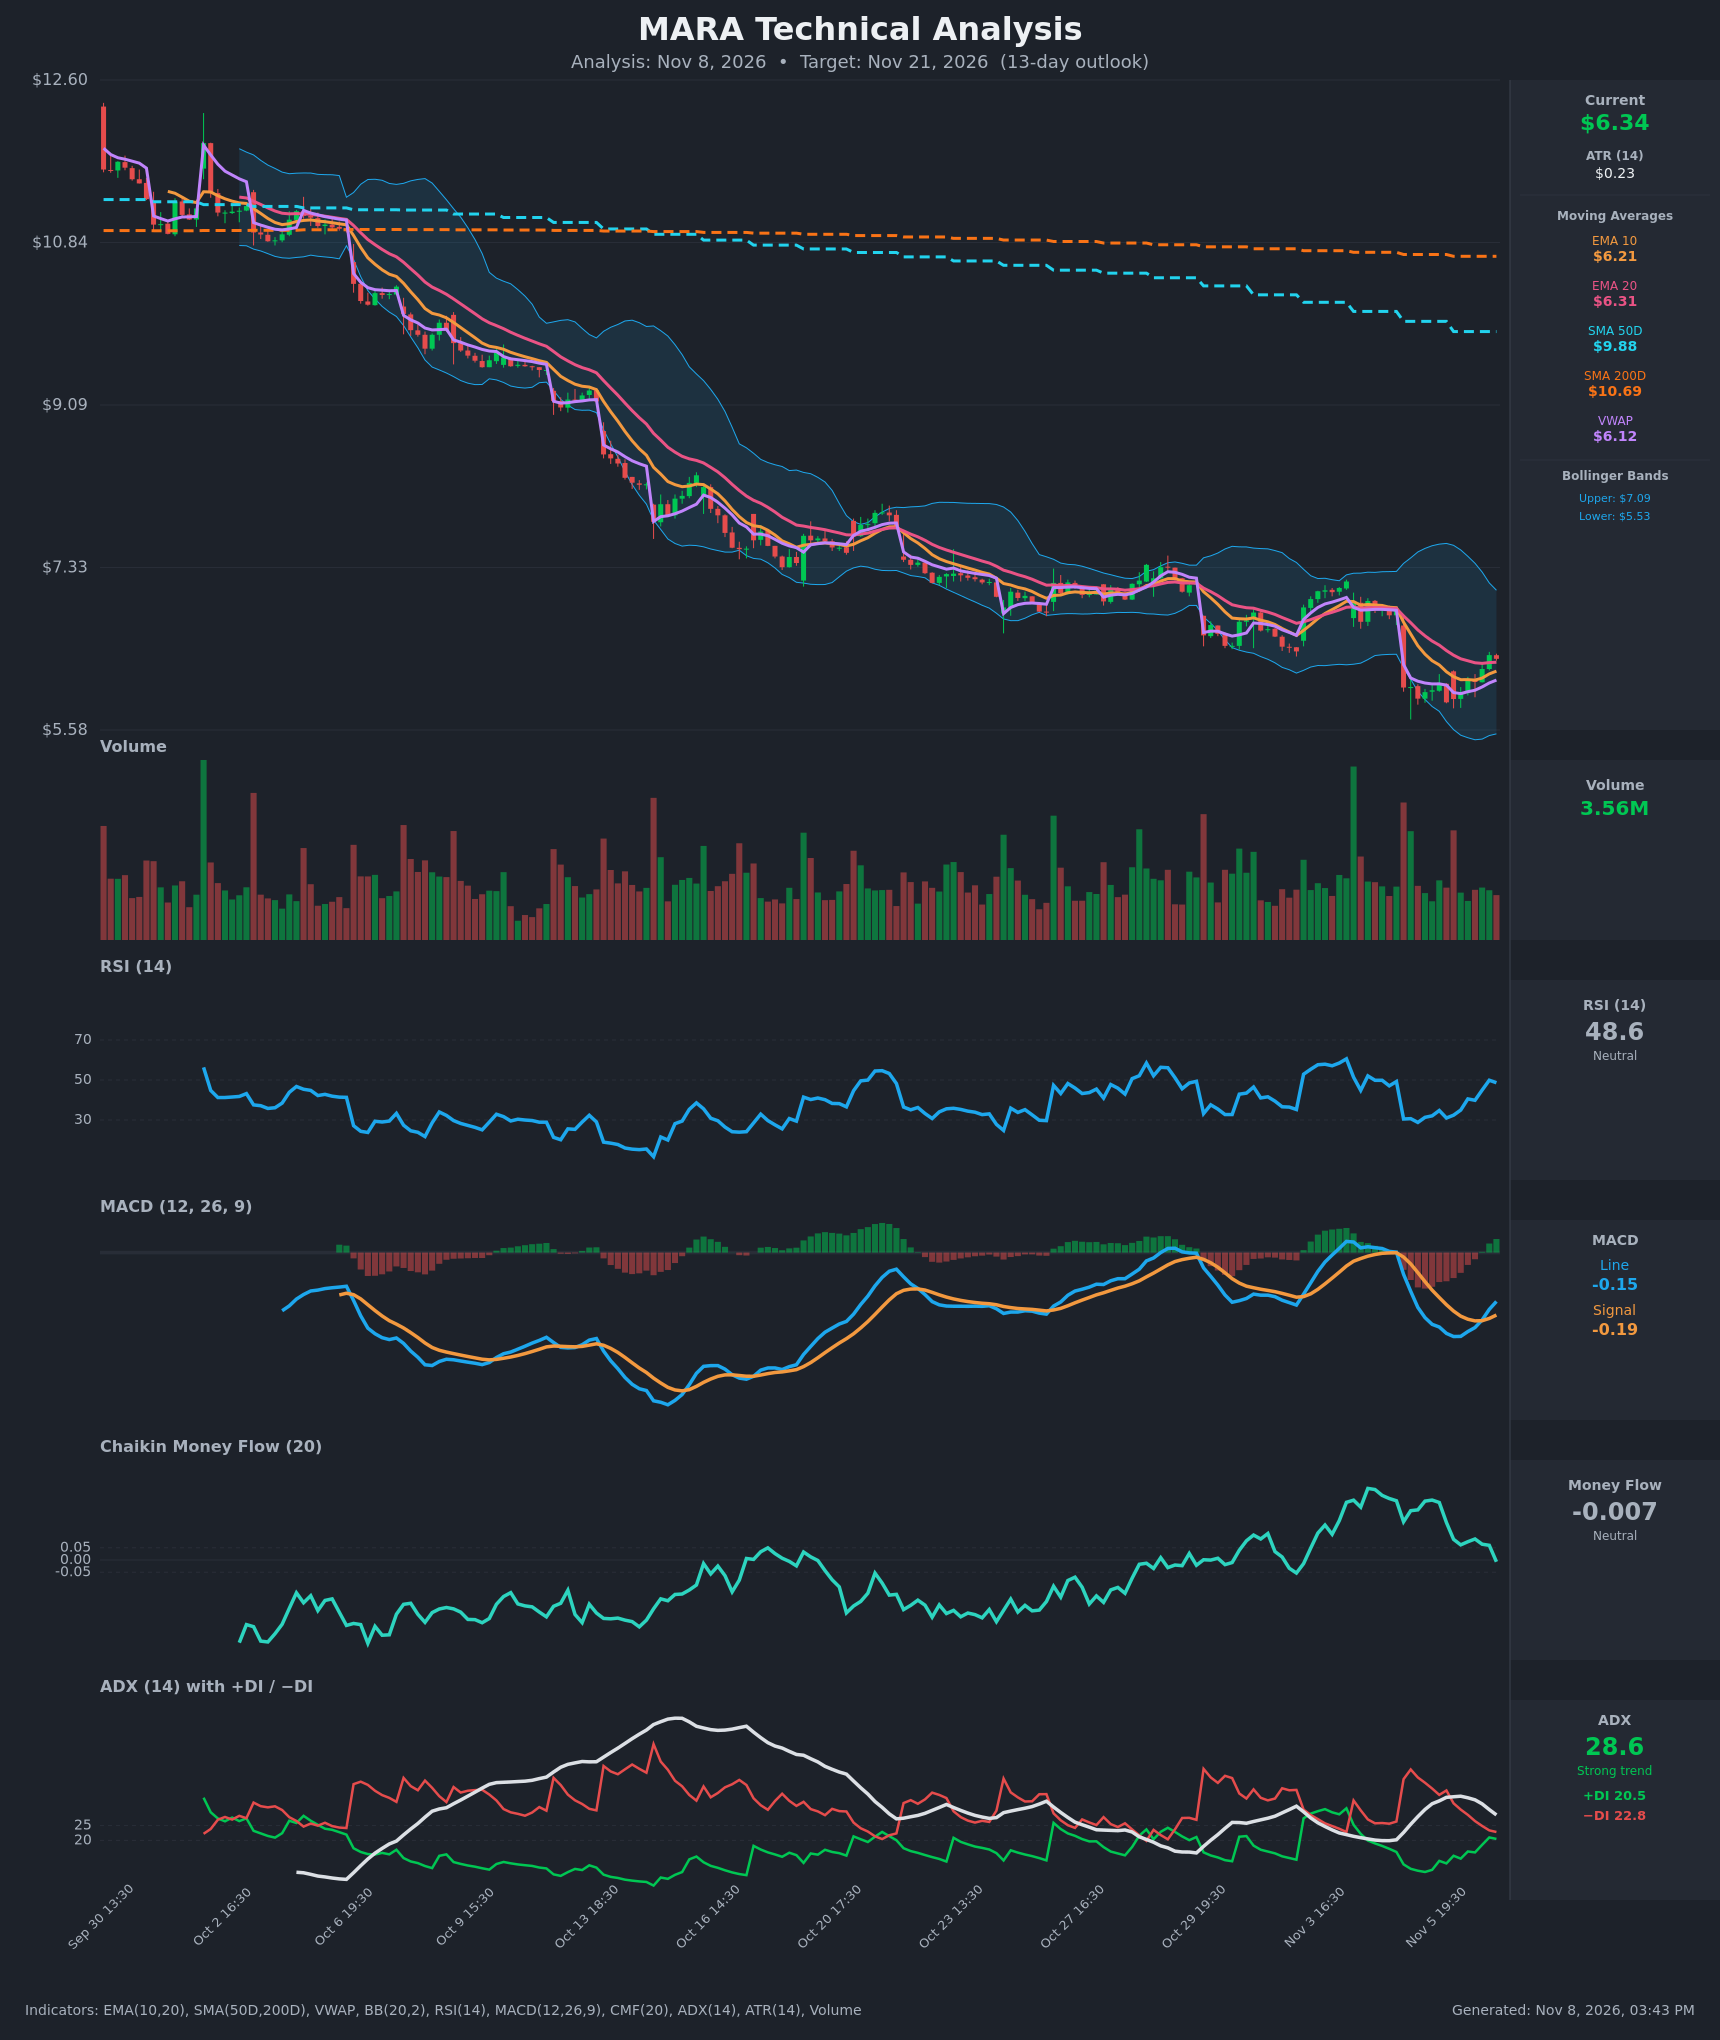
- RSI (14): 48.64, up sharply from the ~29-31 oversold zone on Nov 5-6. It is now at the midline, so the bounce has already used up most of its room before the next test of resistance. [Neutral]
- 20 EMA: $6.3081, with EMA 10 at $6.2119. Price ($6.345) is only just above the 20 EMA after reclaiming it on the last bar. The EMAs are still stacked bearishly (EMA 10 < EMA 20) and both are sloping down, so the 20 EMA is a pivot that has acted as resistance throughout the decline. Price is also far below SMA 50 ($9.88) and SMA 200 ($10.69), a death-cross structure. [Neutral]
- MACD: Line -0.1515 vs signal -0.1935. A bullish crossover occurred on Nov 6 19:30 and the histogram is turning positive. Both lines are still below zero, so this is a counter-trend relief signal inside a bearish regime. [Bullish]
- Bollinger Bands (20): Upper $7.0858, lower $5.5345, midline ≈ $6.31. Price bounced off the lower band and now sits at the midline (≈ 52% of the band width). The bands are wide after the selloff, which leaves room both ways, but the midline has been the cap on every bounce. [Neutral]
- CMF (20): -0.007, neutral and fading from +0.24 on Nov 4. It has just slipped below zero as price rebounds, so the bounce is not backed by accumulation. [Neutral]
- ADX (14): 28.6, a strong trend but falling from ~34.8. −DI (22.8) is still above +DI (20.5), but the gap has narrowed from ~30 points to ~2. The trend remains bearish while losing momentum, and a DI cross is close. [Strong Trend – Bearish, weakening]
- Volume: 3.56M, average with no surge on the bounce. The big volume spikes came on the selloff bars, and the rebound is on ordinary volume. VWAP ($6.1155) sits below price, a mild positive. [Neutral/Weak confirmation of rebound]
DIVERGENCES & TRENDS
- Price made new lows on Nov 5-6 while RSI held around 29-32, so there is no clear bullish divergence. RSI has since risen fast to 48.6.
- The MACD bullish cross is below the zero line, which is typically a relief bounce rather than a trend change.
- CMF is rolling over (0.24 → -0.007) while price rises. This is a mild bearish divergence in money flow against the bounce.
- ADX is falling from its peak with the DI spread nearly closed. Selling pressure is easing, but no bullish DI cross has happened yet.
- Price is reclaiming the EMA 10, EMA 20 and VWAP together, which is the best bullish evidence. Every earlier reclaim since early October failed within days.
- The macro structure is lower highs and lower lows from ~$12 to ~$5.9, with price below both SMAs, and the SMA 50 is well under the SMA 200.
CHART PATTERNS
- Bearish Flag / Falling Wedge-type bounce: After the sharp Nov 5 drop, price is retracing up from $5.88 toward the EMA 20 and the prior breakdown level around $6.88 (Nov 4 close). This resembles a bearish flag or relief-rally structure. A rejection near $6.45-$6.90 followed by a break under $5.88 targets roughly $5.50-$5.55 (the lower band and the flag measured move).
- Longer-term pattern: The multi-week sequence of lower highs and lower lows is a descending channel. It is not a classic reversal pattern yet, because no higher low and no neckline break has been confirmed.
- Bullish alternative: A close above ~$6.90 would break the bounce-structure resistance and open $7.09 (the upper band) and $7.30.
POTENTIAL SCENARIOS
- Scenario 1: Bearish Rejection at EMA/Midline — The relief bounce stalls at the EMA 20 / Bollinger midline and the prevailing downtrend resumes. Trigger: rejection at $6.45-$6.60 and a hourly close back under the EMA 10 ($6.21), then VWAP ($6.12). Target: $6.00-$6.10 first, then $5.75 on a break of $5.88. Invalidation: a sustained close above $6.70. (45% probability)
- Scenario 2: Bullish Relief Rally — The MACD cross, RSI recovery and the reclaim of EMAs and VWAP extend into a larger bounce toward the prior breakdown zone. Trigger: close above $6.55 on rising volume, with +DI crossing above −DI. Target: $6.88, then $7.09. Invalidation: close below $6.12 (VWAP/EMA 10). (35% probability)
- Scenario 3: Neutral Chop — Price oscillates between $5.90 and $6.60 as ADX fades. Trigger: low-volume, overlapping candles around the EMA 20. Target: $6.20-$6.40. Invalidation: break of either $5.88 or $6.70. (20% probability)
PRICE TARGETS
- Target Price: $6.10 (13-day target)
- Expected Range: $5.75 to $6.45. Width is $0.70, or ~11.0% of the current price, which fits a ~13-day horizon.
- Key Levels: Support at $5.88, Resistance at $6.88
OVERALL BIAS
OVERALL BIAS: BEARISH - The dominant trend is down: price is far below both SMAs, −DI is still above +DI with ADX near 29, and CMF is fading as price bounces on unremarkable volume. The MACD cross and RSI recovery are relief-rally signals, and the bounce is likely to fade near the EMA 20 / midline, which has capped every prior rebound. Conviction is modest given the improving short-term momentum.
This is educational analysis and not financial advice.