SLV 13-day bearish forecast — Nov 8, 2026
- Bias: Bearish
- Timeframe: 13 days (made Nov 8, 2026, target date Nov 20, 2026)
- Price at analysis: $46.88
- Price target: $45.90
- Expected range: $44.30 – $49.00
- Result: Pending — graded after the close on Nov 20, 2026
Get a free AI analysis of SLV today
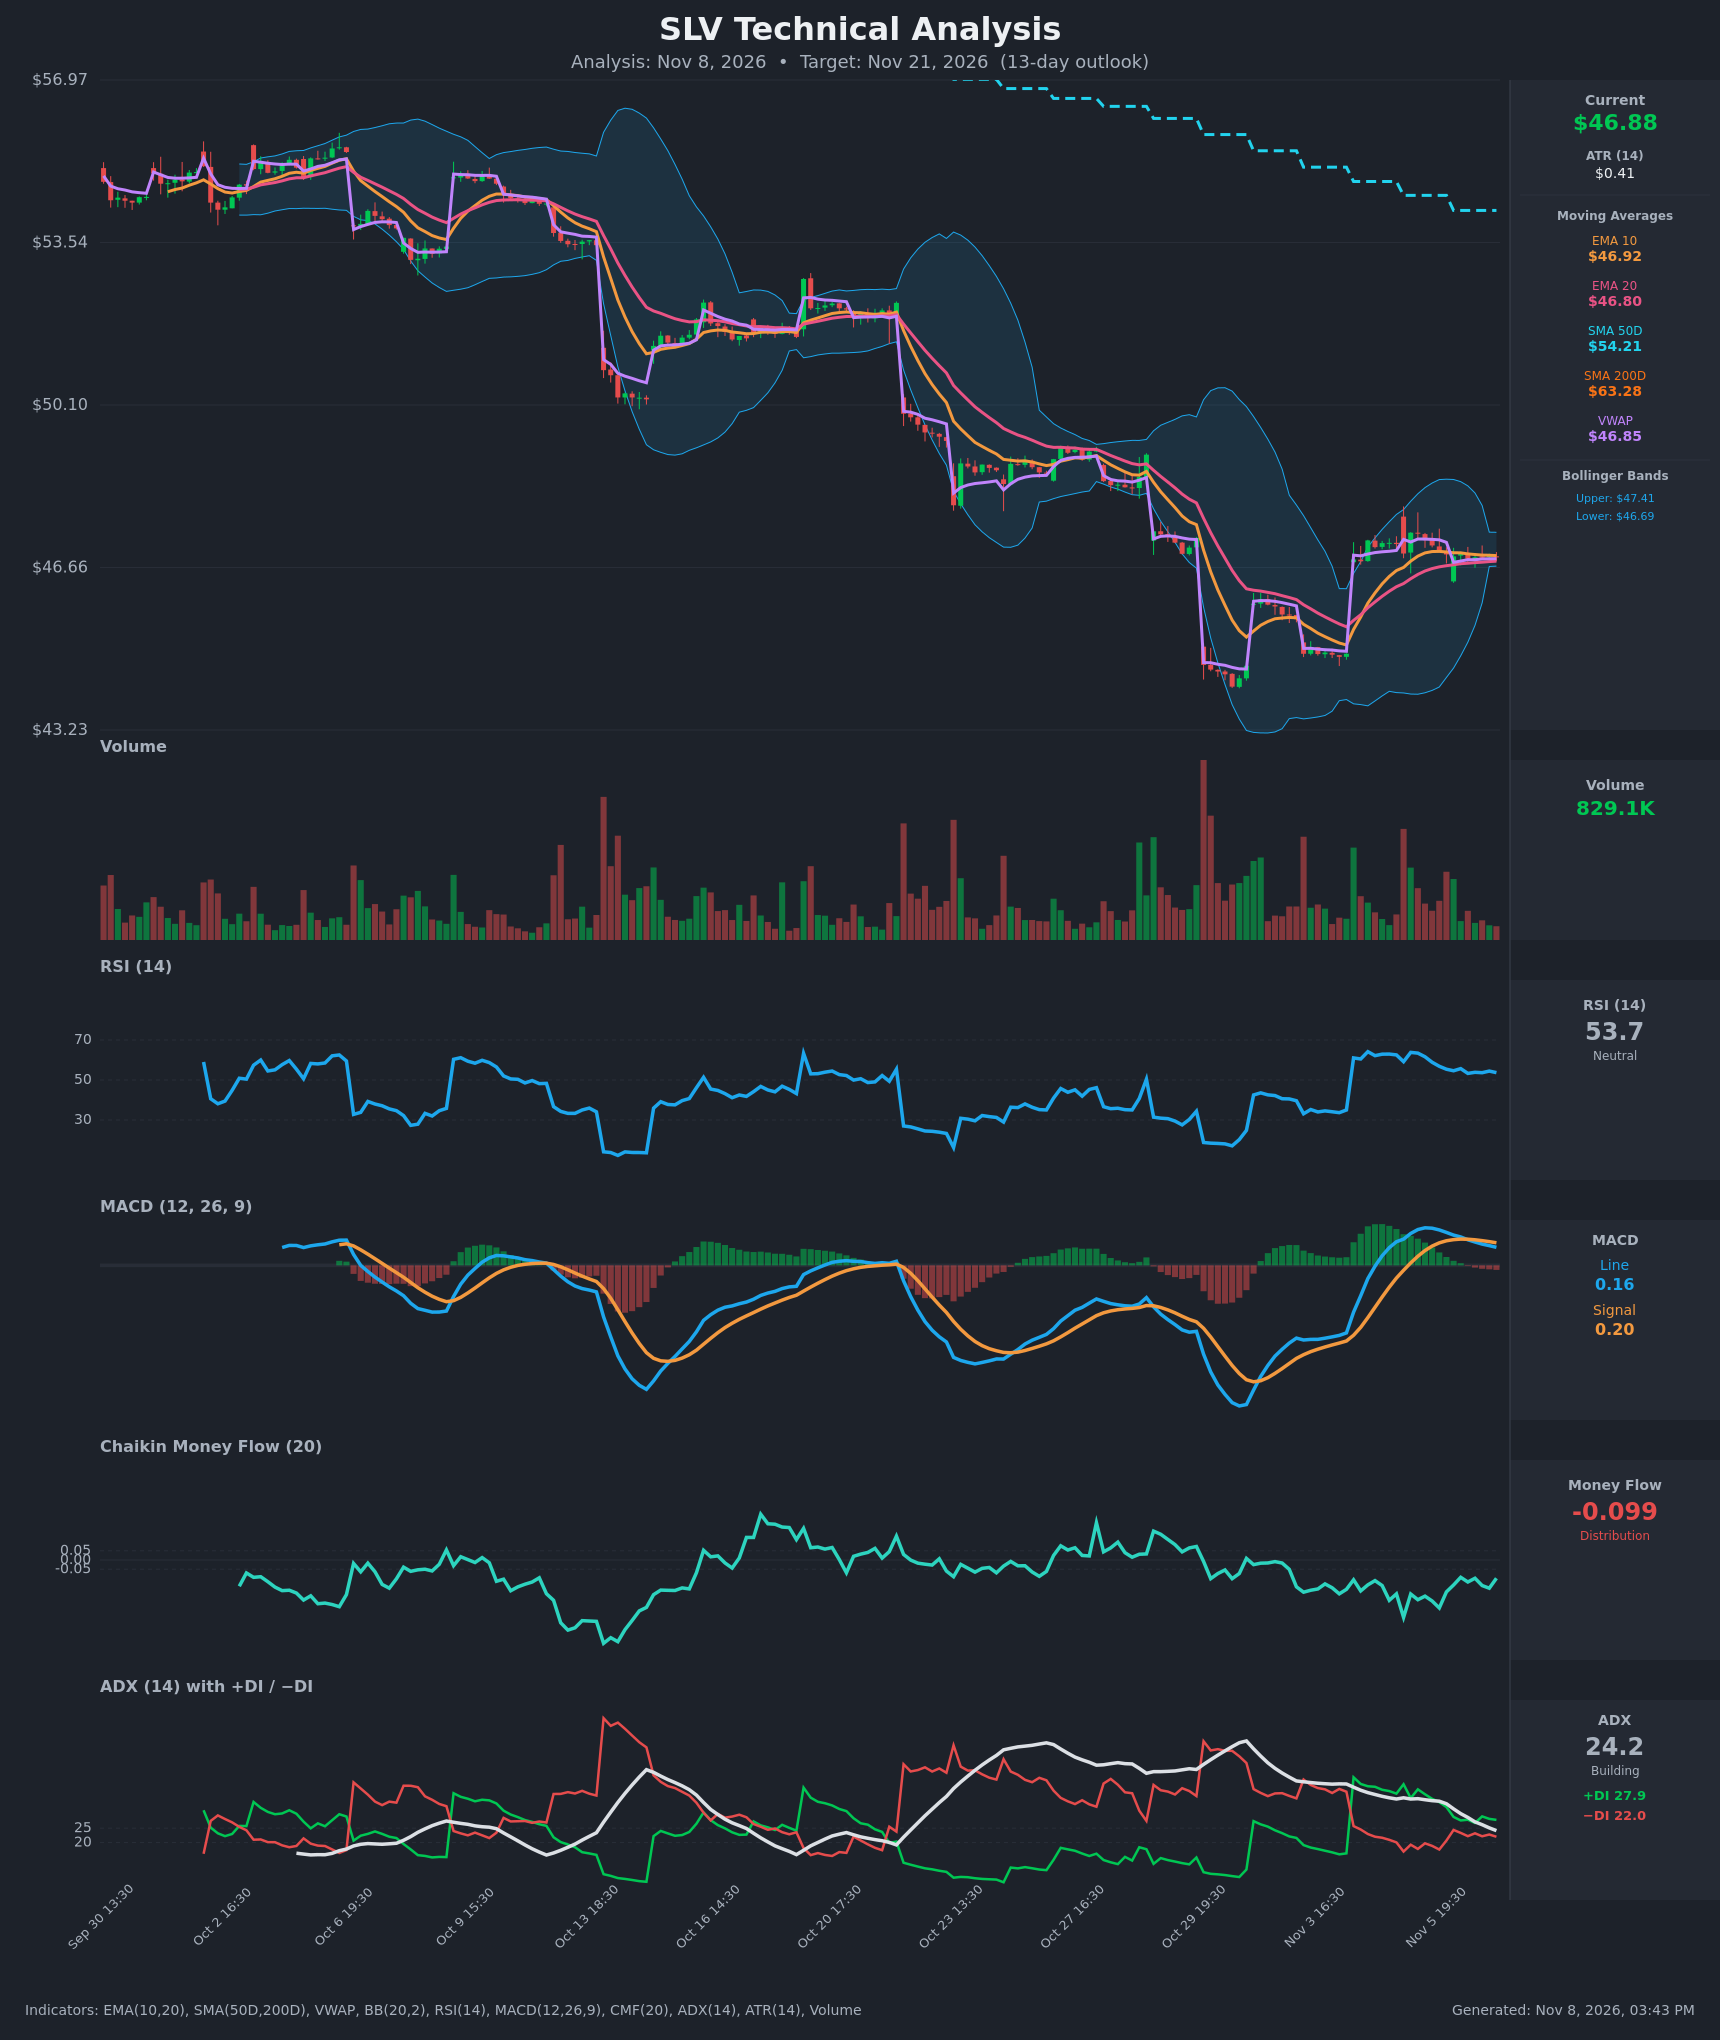
Analysis
TECHNICAL INDICATORS
- RSI (14): 53.68, neutral and drifting down from the 63 area on Nov 5. It has not been oversold or overbought, and momentum is fading after the bounce. [Neutral]
- 20 EMA: $46.80, with price ($46.88) barely above it. EMA10 ($46.92) is still above EMA20, but the gap is narrowing from about $0.34 to about $0.12. The EMAs are flat and clustered with VWAP ($46.85), so support is thin. [Neutral]
- MACD: Line 0.16 is below Signal 0.20. It crossed down on Nov 6 around 16:30 and the histogram is now slightly negative. The line has fallen steadily from 0.33, so momentum is rolling over. [Bearish]
- Bollinger Bands (20): Upper $47.41, lower $46.69, a very tight squeeze with price mid-band. This points to a volatility expansion soon but gives no direction. The bands are far narrower than during the October selloff. [Neutral]
- CMF (20): -0.099, below the -0.05 threshold. It has been negative throughout the bounce, so rallies are being sold into. [Distribution]
- ADX (14): 24.2 and falling from 35, so trend strength is fading. +DI (27.9) is above −DI (22.0), a mild bullish edge, but the spread is narrowing. [Weak Trend, slight bullish DI]
- Volume: 829.1K, with the latest bars at the low end of the recent range. The bounce is not being confirmed by expanding volume. [Low-conviction consolidation]
DIVERGENCES & TRENDS
- Price is holding flat near $46.90, but MACD, RSI and ADX are all trending lower. Momentum is fading faster than price.
- CMF stayed negative during the rebound from about $43.2 to $46.9. This is a bearish divergence, with price rising on weak money flow.
- The MACD bearish crossover on Nov 6 came with the histogram turning negative.
- A death cross is already in place, with SMA50D ($54.22) below SMA200D ($63.28). Price sits about 13% below SMA50D and about 26% below SMA200D, so the long-term trend is firmly down.
- The EMA10/EMA20 bullish cross from the bounce is converging and at risk of reversing.
- The DI spread is narrowing. +DI is still on top, so the bulls retain a small edge in the short term.
CHART PATTERNS
- The tight consolidation after a sharp drop and partial rebound resembles a Bearish Flag/Pennant, a continuation pattern in a prevailing downtrend. The measured move after a breakdown targets roughly the $44.0–$45.0 area, which is also where the pre-bounce lows sit.
- The alternative reading is a Bullish Flag after the rebound from $43.2. That is less convincing given negative CMF, a falling MACD and the heavy overhead resistance from the SMAs.
- The Bollinger squeeze fits either breakout. A close below $46.69 would confirm the bearish read.
POTENTIAL SCENARIOS
- Scenario 1: Bearish Flag Breakdown — Weak momentum, distribution and the dominant downtrend lead to a break below the squeeze range and a retest of the gap area. Trigger: hourly close below $46.69 (BB lower/EMA20) with rising volume. Target: $45.90 initially, then $45.20. Invalidation: sustained close above $47.45. (50% probability)
- Scenario 2: Bullish Relief Extension — +DI stays above −DI and the squeeze resolves upward, pushing price toward the overhead resistance. Trigger: close above $47.41 with volume expansion and a MACD re-cross up. Target: $48.50–$49.00. Invalidation: close back below $46.60. (30% probability)
- Scenario 3: Neutral Chop — The squeeze persists and price oscillates around the EMAs and VWAP. Trigger: continued low volume with ADX falling below 20. Target: $46.50–$47.30. Invalidation: a decisive break of $46.60 or $47.45. (20% probability)
PRICE TARGETS
- Target Price: $45.90 (13-day)
- Expected Range: $44.30 to $49.00 (width $4.70, about 10.0% of current price, consistent with the 8–12% guide for 13 days)
- Key Levels: Support at $45.20, Resistance at $47.40
OVERALL BIAS
OVERALL BIAS: BEARISH - Price is stuck under falling SMA50/SMA200 in a firmly established downtrend. The MACD has crossed bearishly, CMF shows distribution, and the bounce is fading on low volume, so a flag breakdown toward about $45.90 is the most likely outcome. The modest +DI edge and the squeeze keep conviction moderate.
This is educational analysis and not financial advice.