QUBT 13-day bullish forecast — Nov 8, 2026
- Bias: Bullish
- Timeframe: 13 days (made Nov 8, 2026, target date Nov 20, 2026)
- Price at analysis: $6.33
- Price target: $6.52
- Expected range: $5.98 – $6.68
- Result: Pending — graded after the close on Nov 20, 2026
Get a free AI analysis of QUBT today
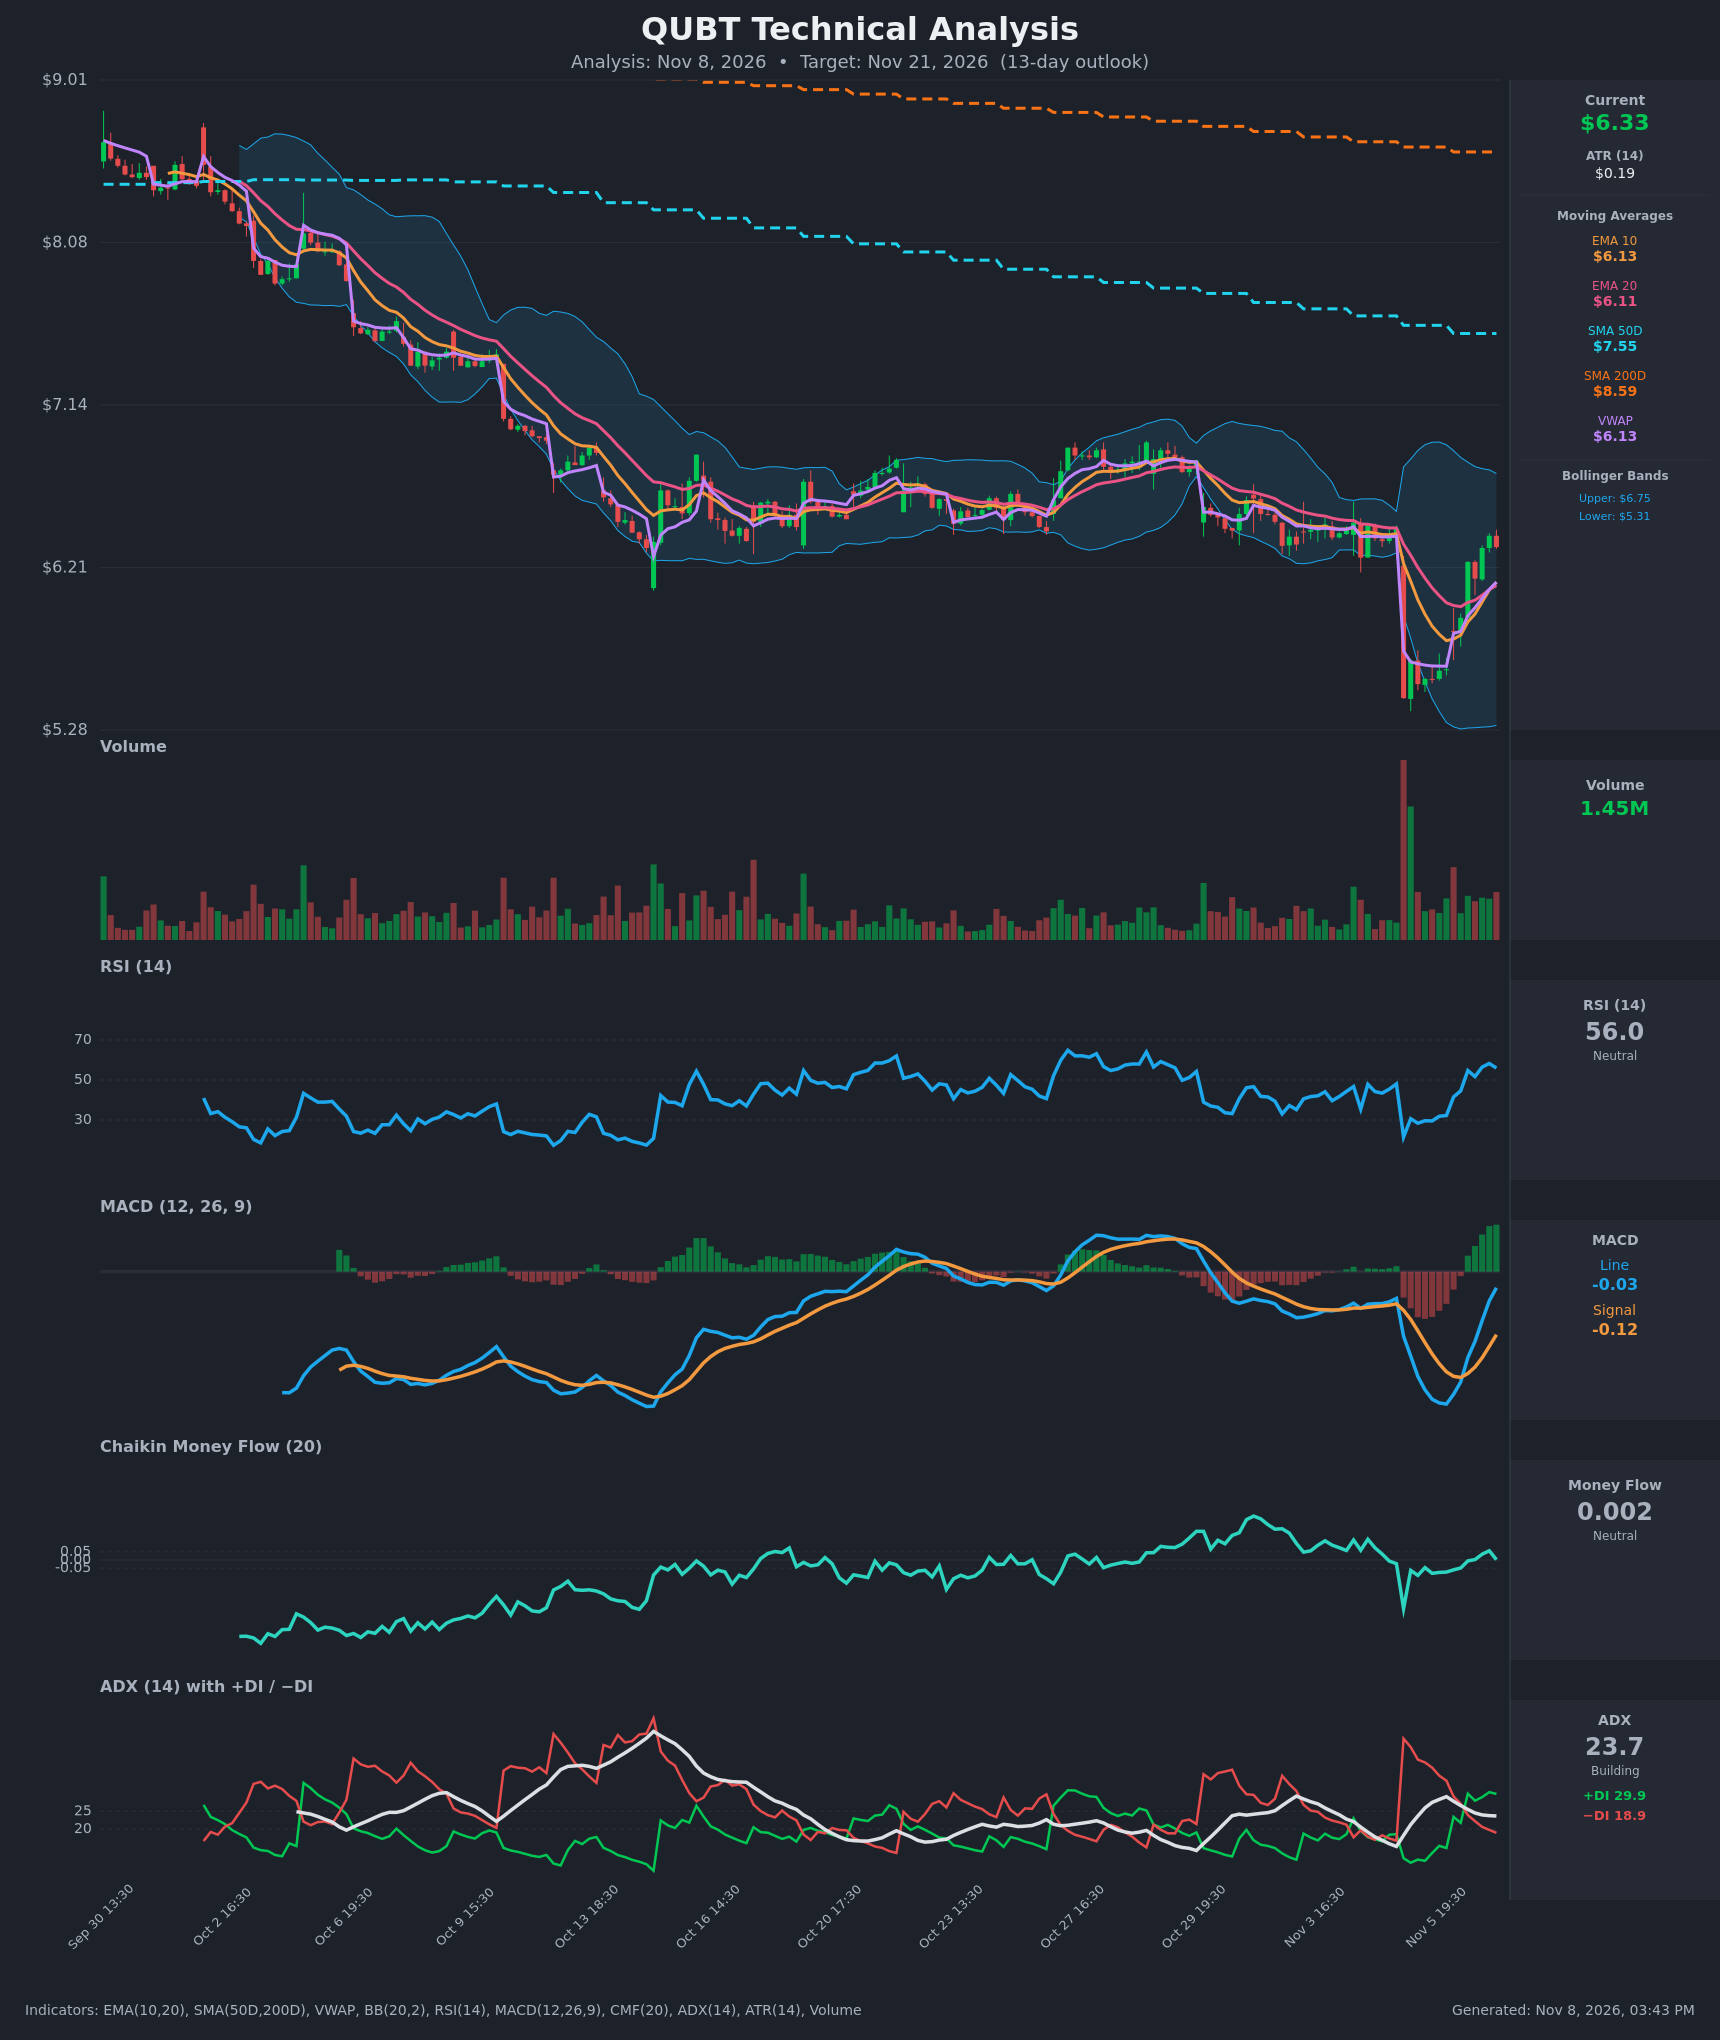
Analysis
TECHNICAL INDICATORS
- RSI (14): 55.97, up sharply from the 21.5 oversold reading on Nov 5. It has climbed back through 50 and has room before 70. Momentum is improving. [Bullish]
- 20 EMA: $6.11, with EMA10 at $6.13. Price at $6.33 is above both, and EMA10 crossed above EMA20 on Nov 6, so the EMAs are now short-term support. Both are still well below the SMA50 ($7.55) and SMA200 ($8.59). [Bullish]
- MACD: The line (-0.031) is still below the signal (-0.120), but the gap is closing fast. The histogram is positive and expanding (about +0.09), and the line is approaching zero. This is a bullish momentum turn, though not yet a zero-line confirmation. [Bullish]
- Bollinger Bands (20): Upper $6.75, lower $5.31, midline about $6.03. The bands are very wide because of the Nov 5 gap-down. Price has moved from the lower band back into the upper half, and the upper band at $6.75 is the next volatility target. [Bullish]
- CMF (20): 0.002, inside the ±0.05 neutral zone. It dipped to -0.30 on the gap day and has recovered to flat. Buyers are not yet clearly accumulating. [Neutral]
- ADX (14): 23.7 and building, with +DI 29.9 above −DI 18.9. The −DI dominance from the selloff has flipped to bulls. ADX is just under 25, so the trend is not yet strong. [Weak-to-Moderate Trend, Bullish direction]
- Volume: 1.45M, well below the huge capitulation volume on the Nov 5 gap-down. The rebound bars are moderate, with green bars slightly favored. The bounce is constructive but lacks strong conviction. [Mildly Bullish]
DIVERGENCES & TRENDS
- There is no classic divergence. RSI and MACD turned up from the lows alongside price, so the bounce is confirmed by momentum.
- VWAP ($6.13) is now below price, which points to buyers in control intraday.
- The EMA10/EMA20 bullish cross and the +DI/−DI flip both took place within the last 2 sessions.
- The MACD line is closing in on the signal line and zero, so a bullish signal-line cross is likely within days.
- The long-term trend is still bearish. Price is below a falling SMA50 and SMA200, with a death-cross structure (SMA50 under SMA200).
- The Nov 5 gap-down leaves an unfilled gap at about $6.43 to $6.50, which is the first resistance.
- CMF has not confirmed the move with sustained accumulation.
CHART PATTERNS
- Prior structure: From Oct 14 to Nov 4, price traded sideways between about $6.4 and $6.9. This resembles a Bearish Pennant/Rectangle consolidation inside a larger downtrend. It resolved with a gap-down to $5.46.
- Current setup: A sharp V-shaped recovery is now working back toward that gap. This is typically a gap-fill retest. If it fails near $6.45 to $6.55, the bearish continuation structure stays intact. A close above about $6.55 to $6.75 would negate the breakdown and suggest the selloff was a flush.
- Targets: The pattern-implied downside from the breakdown is the $5.30 area, which was already hit. The upside from the retest is the upper Bollinger Band and range top at about $6.75 to $6.90.
POTENTIAL SCENARIOS
- Scenario 1: Bullish Gap Fill and Push to Range Top — Momentum carries price through the $6.43 to $6.50 gap area, the MACD crosses its signal, and ADX rises above 25 with +DI leading. Trigger: Daily or hourly close above $6.50 on rising volume. Target: $6.75 (upper BB), with an extension toward $6.90. Invalidation: Close below $6.10 (EMA20/VWAP cluster). (45% probability)
- Scenario 2: Bearish Rejection at Gap Resistance — The bounce stalls at the gap, matching the bearish continuation pattern and the falling SMAs. Price rolls over, loses the EMAs and revisits the post-gap lows. Trigger: Rejection at $6.45 to $6.55 followed by a break below $6.10. Target: $5.85, then $5.50. Invalidation: Sustained close above $6.60. (30% probability)
- Scenario 3: Neutral Chop Below Gap — Price consolidates between the EMAs and the gap. CMF stays flat and ADX stays under 25. Trigger: Failure to break either $6.10 or $6.55 for several sessions. Target: $6.20 to $6.45. Invalidation: Close outside $6.05 to $6.60. (25% probability)
PRICE TARGETS
- Target Price: $6.52 (13-day)
- Expected Range: $5.98 to $6.68. The width is $0.70, or about 11% of the current price, which is consistent with a 13-day horizon.
- Key Levels: Support at $6.11 (EMA20/VWAP cluster, with $5.50 as the deeper post-gap low). Resistance at $6.75 (upper BB and prior range top), with the gap-fill zone at $6.45 to $6.50 as the first hurdle.
OVERALL BIAS
OVERALL BIAS: BULLISH - Short-term momentum is clearly improving. RSI is back above 50, MACD is closing in on a bullish cross with a rising histogram, the EMAs have crossed up, and +DI has taken control. The bias is modest because the gap-fill resistance, falling SMA50/SMA200 and neutral CMF cap the upside.
This is educational analysis and not financial advice.