ARM 20-day bearish forecast — Nov 8, 2026
- Bias: Bearish
- Timeframe: 20 days (made Nov 8, 2026, target date Nov 27, 2026)
- Price at analysis: $174.62
- Price target: $168.00
- Expected range: $148.00 – $190.00
- Result: Pending — graded after the close on Nov 27, 2026
Get a free AI analysis of ARM today
Analysis
TECHNICAL INDICATORS
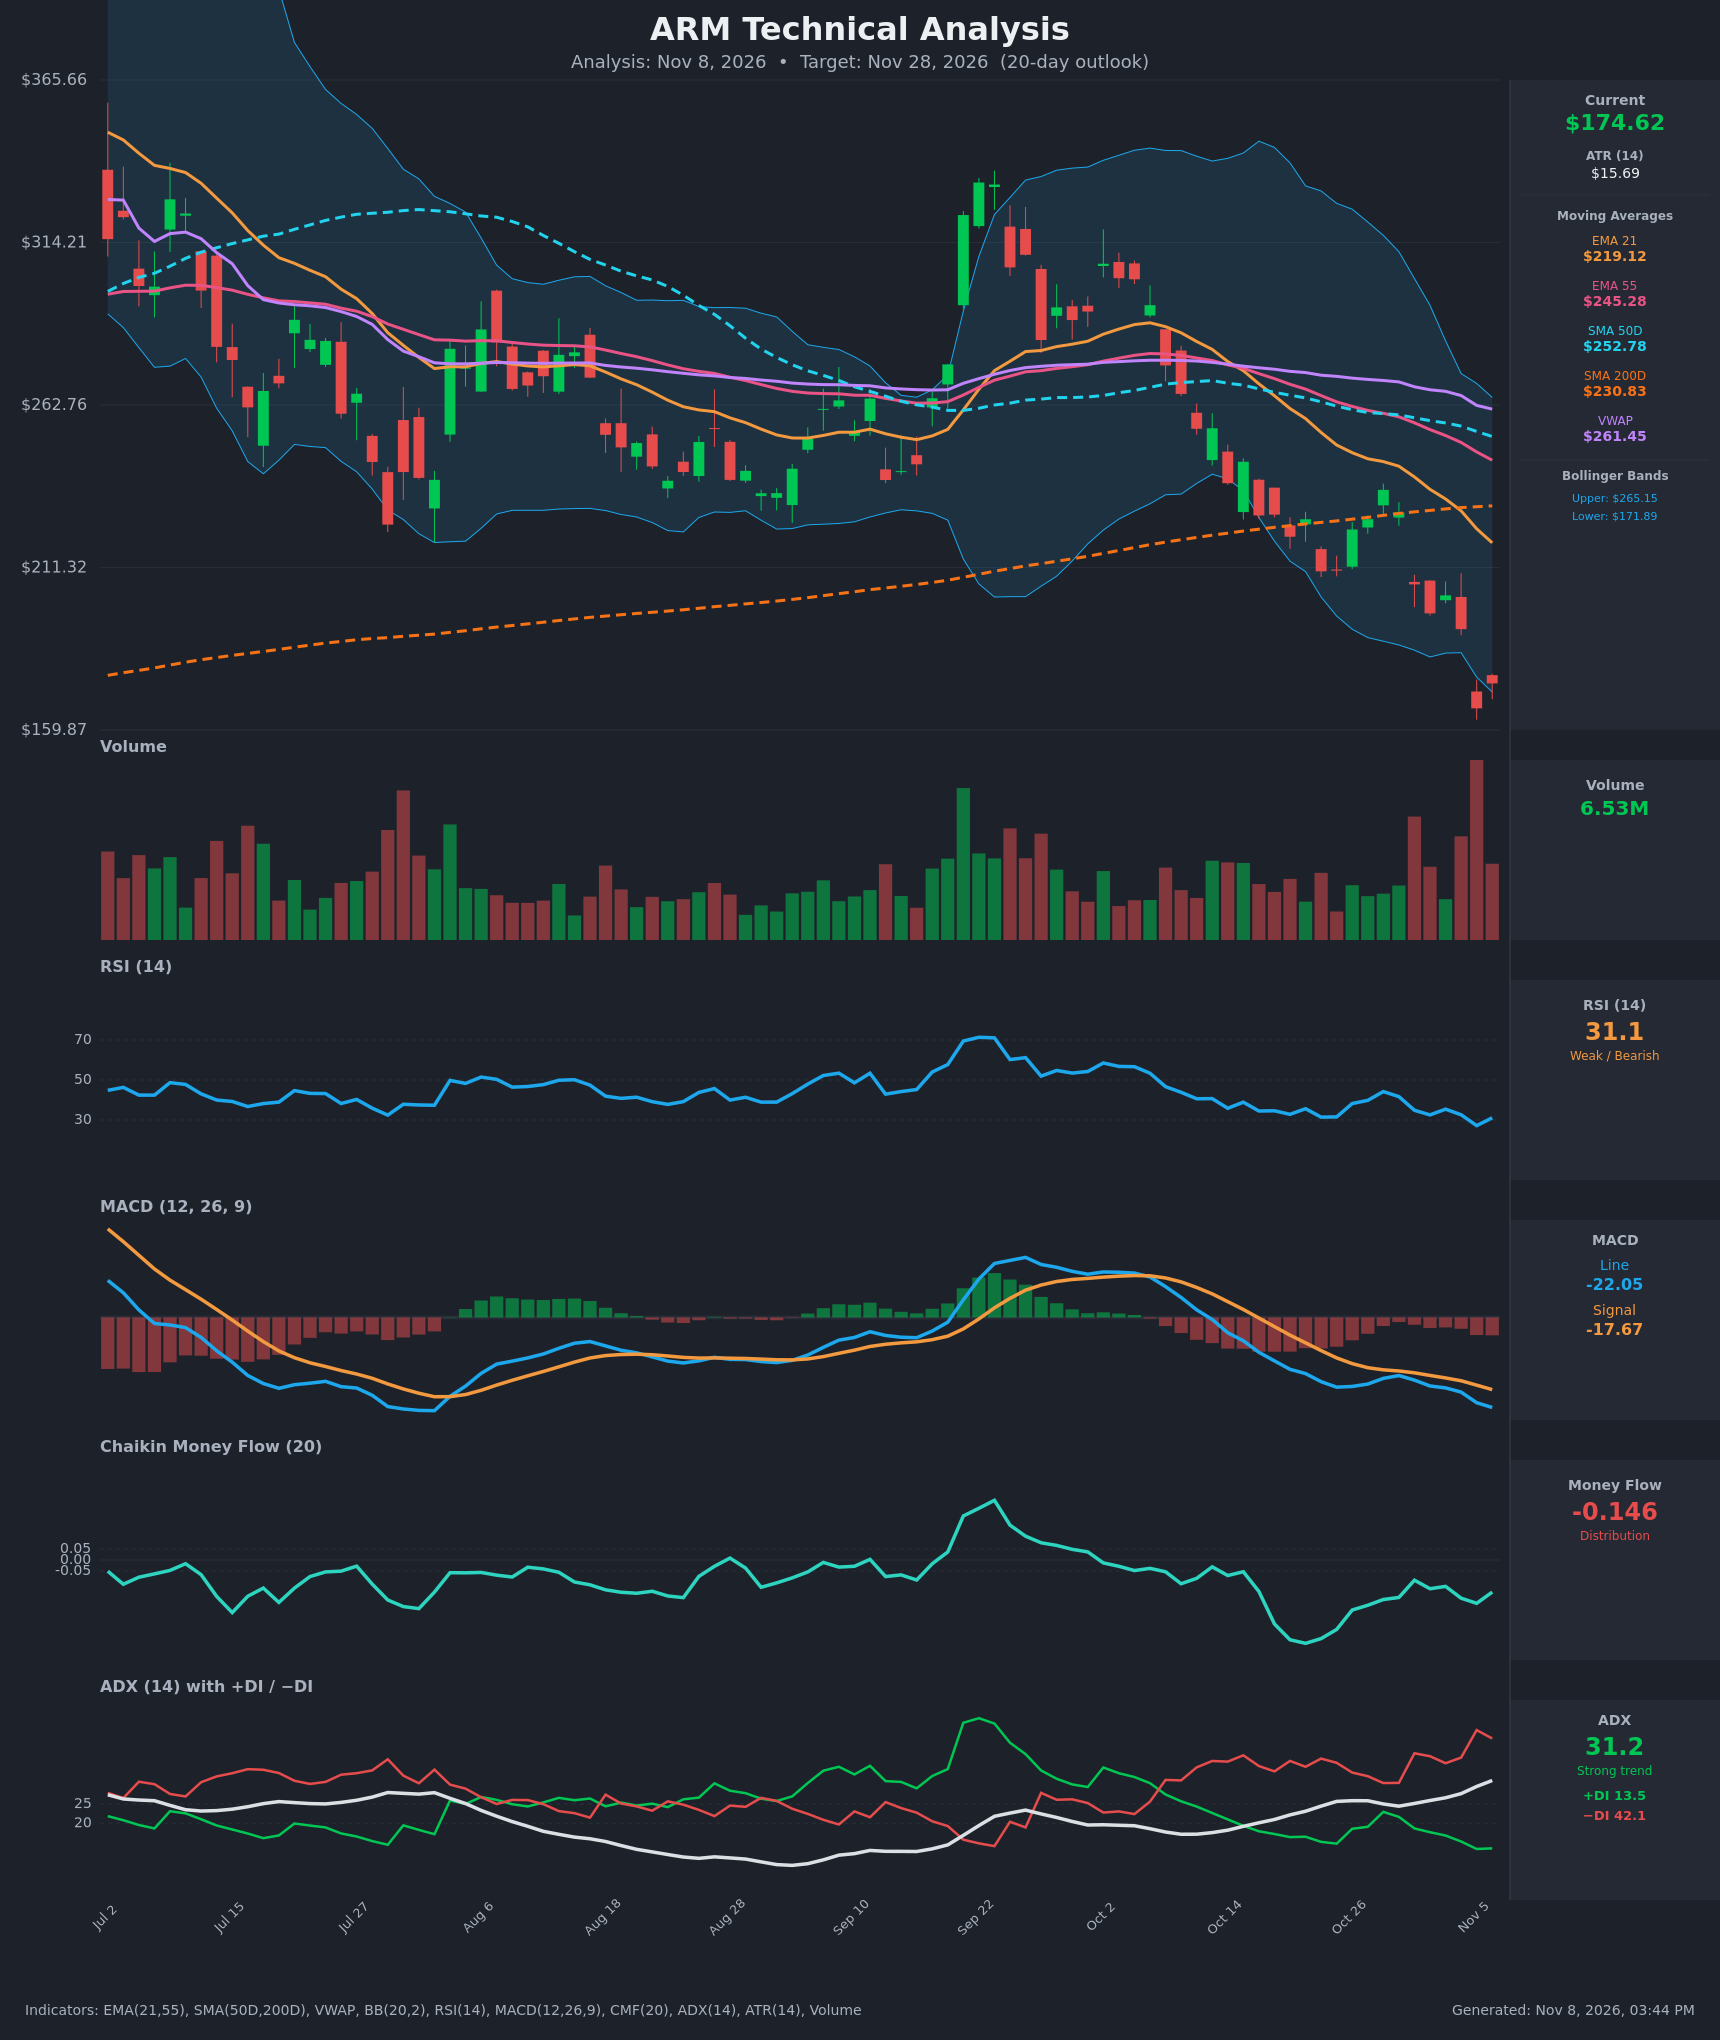
- RSI (14): 31.08, just off the 27.2 low on Nov 5. It is near oversold but has not made a bullish divergence. It has been sub-45 since late September, so momentum is bearish with a possible short-term bounce. [Bearish]
- 20 EMA: The 21 EMA is $219.12 and price at $174.62 is about 20% below it. The EMA is falling steeply, so it acts as overhead resistance. EMA21 is also below EMA55 ($245.28). [Bearish]
- MACD: Line -22.05 is below signal -17.67, and the gap is widening. The histogram is negative and still expanding. The bearish crossover happened in early October and no turn is visible. [Bearish]
- Bollinger Bands (20): Upper $265.15 and lower $171.89. Price at $174.62 is hugging the lower band after a close at $166.72 on Nov 5 that was likely below it. The bands are wide, which shows high volatility. This is a "band walk" in a downtrend, but a mean-reversion bounce is possible. [Bearish]
- CMF (20): -0.146, well below -0.05 and negative for the whole decline. Selling pressure is persistent with no accumulation. [Distribution]
- ADX (14): 31.2 and rising, with −DI 42.1 well above +DI 13.5. The trend is strong, and it is a downtrend. [Strong Trend – Bearish]
- Volume: 6.53M on the latest bar. The Nov 5 breakdown had the highest volume in the window, on a big red candle, which looks like a capitulation or distribution flush. Heavy volume on the break lower confirms selling. [Bearish – high-volume breakdown]
DIVERGENCES & TRENDS
- No bullish divergence yet. Price made a new low at $166.72 and RSI made a new low at 27.2, so they confirm each other.
- The moving averages are stacked bearishly: price < EMA21 ($219.12) < SMA200D ($230.83) < EMA55 ($245.28) < SMA50D ($252.78) < VWAP ($261.45).
- Price broke below the SMA200D (~$230) in late October and has not reclaimed it. That is a long-term trend break.
- SMA50D ($252.78) is still above SMA200D ($230.83), so there is no death cross yet. SMA50D is rolling over and the spread is narrowing, so a death cross is plausible in coming weeks.
- EMA21 crossed below EMA55 in mid-October (a bearish crossover).
- MACD is bearish and the histogram is deepening, so momentum is accelerating down.
- Nov 6 was a small bounce (+4.7%) off the lows. It is only a relief bounce so far, and RSI is back above 30 but has not recovered anywhere near 50.
CHART PATTERNS
- The chart shows a Bearish Rising Wedge / failed rally structure, a sharp spike to ~$330 in late September followed by lower highs. A Bearish Head and Shoulders-like top is visible, with the September spike as the head and the neckline near the $211–$230 zone broken in late October.
- The measured move from the breakdown points to the $170–$180 region, which has now been reached.
- Following the diagram's bearish continuation logic, a Bearish Flag/Pennant may form after the Nov 5 flush. A weak bounce to $195–$205 that fails would fit that pattern.
- Price is at the Bollinger lower band and near the ATR-based extension, so some oversold bounce risk exists. This is not a confirmed reversal pattern such as a double bottom.
POTENTIAL SCENARIOS
- Scenario 1: Bearish Trend Continuation — Price rolls over from the relief bounce, stays under the falling EMA21, and keeps walking the lower band. Trigger: failure at $190–$200 or a close below $166.72. Target: $150–$160. Invalidation: daily close above $205 with improving CMF. (50% probability)
- Scenario 2: Bullish Oversold Relief Bounce — RSI near 30, price at the lower band, and a capitulation-volume bar set up a mean-reversion bounce toward the EMA21. Trigger: close above $190 with RSI back above 40. Target: $200–$215. Invalidation: close below $166. (30% probability)
- Scenario 3: Neutral Basing Range — Price chops between $165 and $195 as selling exhausts. Trigger: low-volume consolidation with ADX falling. Target: $170–$185. Invalidation: break of either boundary. (20% probability)
PRICE TARGETS
For a 20-day timeframe, the Expected Range should be ~8-12% of current price, widened somewhat for ATR/volatility (ATR $15.69 is ~9% of price).
- Target Price: $168.00
- Expected Range: $148.00 to $190.00 (width $42 ≈ 24% of price, which is wider than the normal 20-day guide because of ATR volatility and the high-vol regime)
- Key Levels: Support at $166.72 (Nov 5 low), Resistance at $195.00 (area of the Oct 30 gap/prior breakdown; EMA21 at $219.12 is the next resistance above)
OVERALL BIAS
OVERALL BIAS: BEARISH - Strong downtrend (ADX 31.2, −DI 42.1 vs +DI 13.5) with a widening bearish MACD, persistent distribution (CMF -0.146), and price below every major moving average after a high-volume breakdown. An oversold bounce is possible, but the trend evidence favors a lower target.
This is educational analysis and not financial advice.