GLD 20-day bullish forecast — Nov 8, 2026
- Bias: Bullish
- Timeframe: 20 days (made Nov 8, 2026, target date Nov 27, 2026)
- Price at analysis: $372.52
- Price target: $379.50
- Expected range: $360.50 – $396.00
- Result: Pending — graded after the close on Nov 27, 2026
Get a free AI analysis of GLD today
Analysis
TECHNICAL INDICATORS
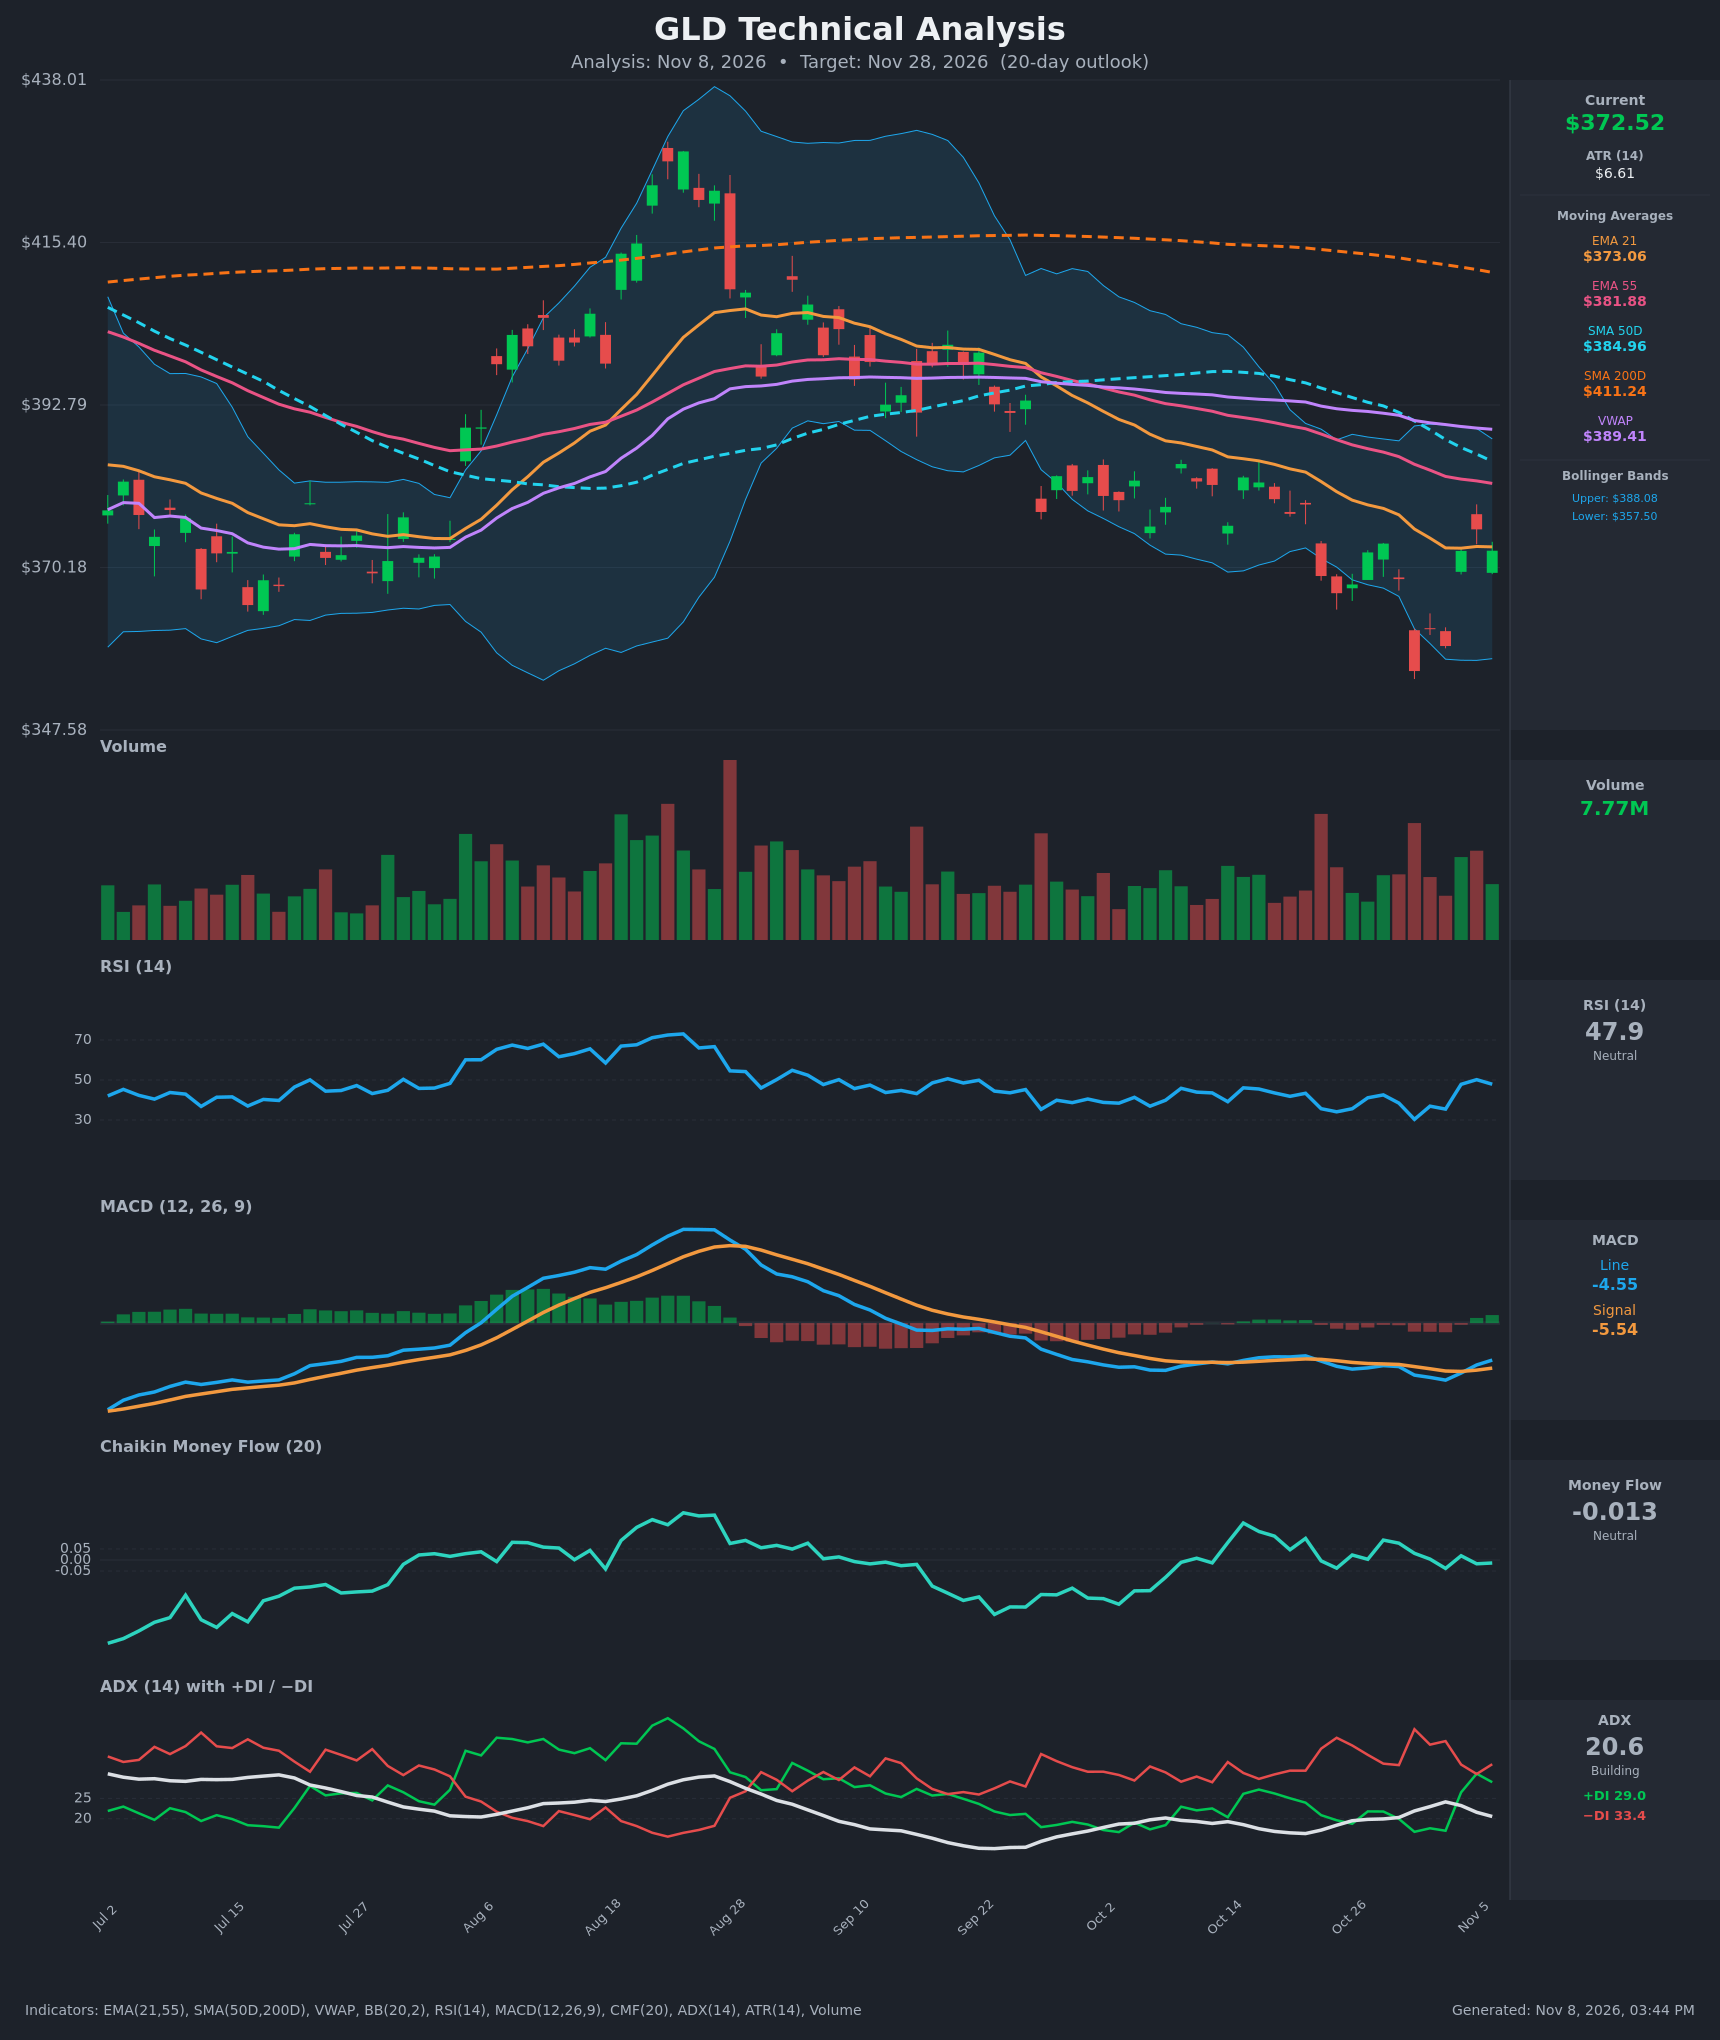
- RSI (14): 47.89, recovered from an oversold 30.3 on Oct 30 and sitting just below the 50 midline. Momentum is turning up but has not yet pushed through 50. [Neutral]
- 20 EMA: EMA21 is $373.06 and price is $372.52, essentially on it. Price reclaimed it on Nov 4-5 and is now testing it as support. EMA21 is still falling slowly and sits below EMA55 ($381.88), so the short-term stack stays bearish. [Neutral]
- MACD: Line -4.55, signal -5.54, histogram about +0.99. The MACD line crossed above the signal on Nov 4 and the histogram has risen for three bars. Both lines are still below zero, so this is a bottoming turn rather than a confirmed uptrend. [Bullish]
- Bollinger Bands (20): Upper $388.08, lower $357.50, midline about $372.8. Price bounced off the lower band (Oct 30 close $355.78, below the band) and is back at the midline. Band width is moderate, and a hold above the midline opens a move toward the upper band. [Neutral]
- CMF (20): -0.013, inside the ±0.05 neutral zone. It has oscillated around zero for weeks with no sustained accumulation or distribution. [Neutral]
- ADX (14): 20.6 and falling from 24.1, with -DI at 33.4 above +DI at 29.0. The trend is weak and fading. Bears are still marginally on top, but the DI gap has narrowed sharply from 20+ points on Oct 30 to about 4. [Weak Trend, slight bearish tilt]
- Volume: 7.77M, with a heavy up bar on the Nov 4 reversal day (+3.7%) and the follow-through green bar. The bounce came on above-average buying volume, a modest sign of dip buyers. The Oct 30 selloff volume was also heavy, which marks a likely capitulation low. [Mildly Bullish]
DIVERGENCES & TRENDS
- Bullish divergence: price made a lower low at $355.78 (Oct 30), but the MACD histogram flattened and has since turned positive. RSI also bottomed at 30.3, well above its earlier lows, and has recovered to about 48.
- MACD: bullish crossover on Nov 4, and the line is rising toward the zero line.
- DI convergence: -DI fell from 42.0 to 33.4 and +DI rose from 16.8 to 29.0. A +DI/-DI crossover is possible in the coming sessions.
- Moving averages: the SMA50D ($384.96) is well below the SMA200D ($411.24), a long-standing death cross, and price is below every major average except the EMA21. The bigger trend is bearish, and the MAs overhead cluster at $382-$385 as resistance.
- VWAP: price is about 4% below VWAP ($389.41), so there is room for mean reversion but also persistent overhead supply.
CHART PATTERNS
- Bullish Double Bottom (developing): lows at $355.78 (Oct 30) and about $359.26 (Nov 3) form a W, with a neckline around $375-$376 (the Nov 5 close of $375.49). Price is testing that neckline now. A confirmed close above $376 gives a measured move of about $20 (neckline minus low), pointing to roughly $395. I treat a more conservative first target as the $382-$385 MA cluster.
- Caveat: the broader move from the $425 peak is a descending sequence of lower highs. If the neckline fails, the same structure reads as a bear-flag-style pause within a downtrend, with $356-$359 as the trigger.
POTENTIAL SCENARIOS
- Scenario 1: Bullish Double Bottom Breakout — The MACD crossover, RSI recovery and bounce volume support a neckline break and a push into the moving-average cluster. Trigger: daily close above $376, then above the EMA55 at $381.88. Target: $380-$385, with an extension to about $390 (BB upper and VWAP zone). Invalidation: daily close below $359. (45% probability)
- Scenario 2: Bearish Rejection and Trend Continuation — Price stalls under the falling EMAs, -DI reasserts, and the lower highs sequence continues. Trigger: rejection at $376-$382 and a close below the EMA21 and $366. Target: retest of $356-$358, with a possible break toward $350. Invalidation: daily close above $385. (35% probability)
- Scenario 3: Neutral Range Chop — ADX stays near or below 20 and price oscillates between $360 and $382. Trigger: failure to close beyond either $376 or $360. Target: $368-$376. Invalidation: a daily close outside $358-$385. (20% probability)
PRICE TARGETS
- Target Price: $379.50 (20-day, Nov 28, 2026)
- Expected Range: $360.50 to $396.00 (width $35.50, about 9.5% of the current price, consistent with the 14-21 day guidance)
- Key Levels: Support at $359.26, Resistance at $381.88
OVERALL BIAS
OVERALL BIAS: BULLISH - A developing double bottom at $356-$359 is testing its neckline near $376, the MACD has crossed up with a rising histogram, RSI has recovered from oversold, and the bounce came on strong volume. Conviction is modest because price remains below the SMA50, SMA200 and VWAP, ADX is weak, and -DI is still above +DI, so $382-$385 should be heavy resistance.
This is educational analysis and not financial advice.