IREN 20-day bearish forecast — Nov 8, 2026
- Bias: Bearish
- Timeframe: 20 days (made Nov 8, 2026, target date Nov 27, 2026)
- Price at analysis: $21.64
- Price target: $20.10
- Expected range: $18.90 – $21.70
- Result: Pending — graded after the close on Nov 27, 2026
Get a free AI analysis of IREN today
Analysis
TECHNICAL INDICATORS
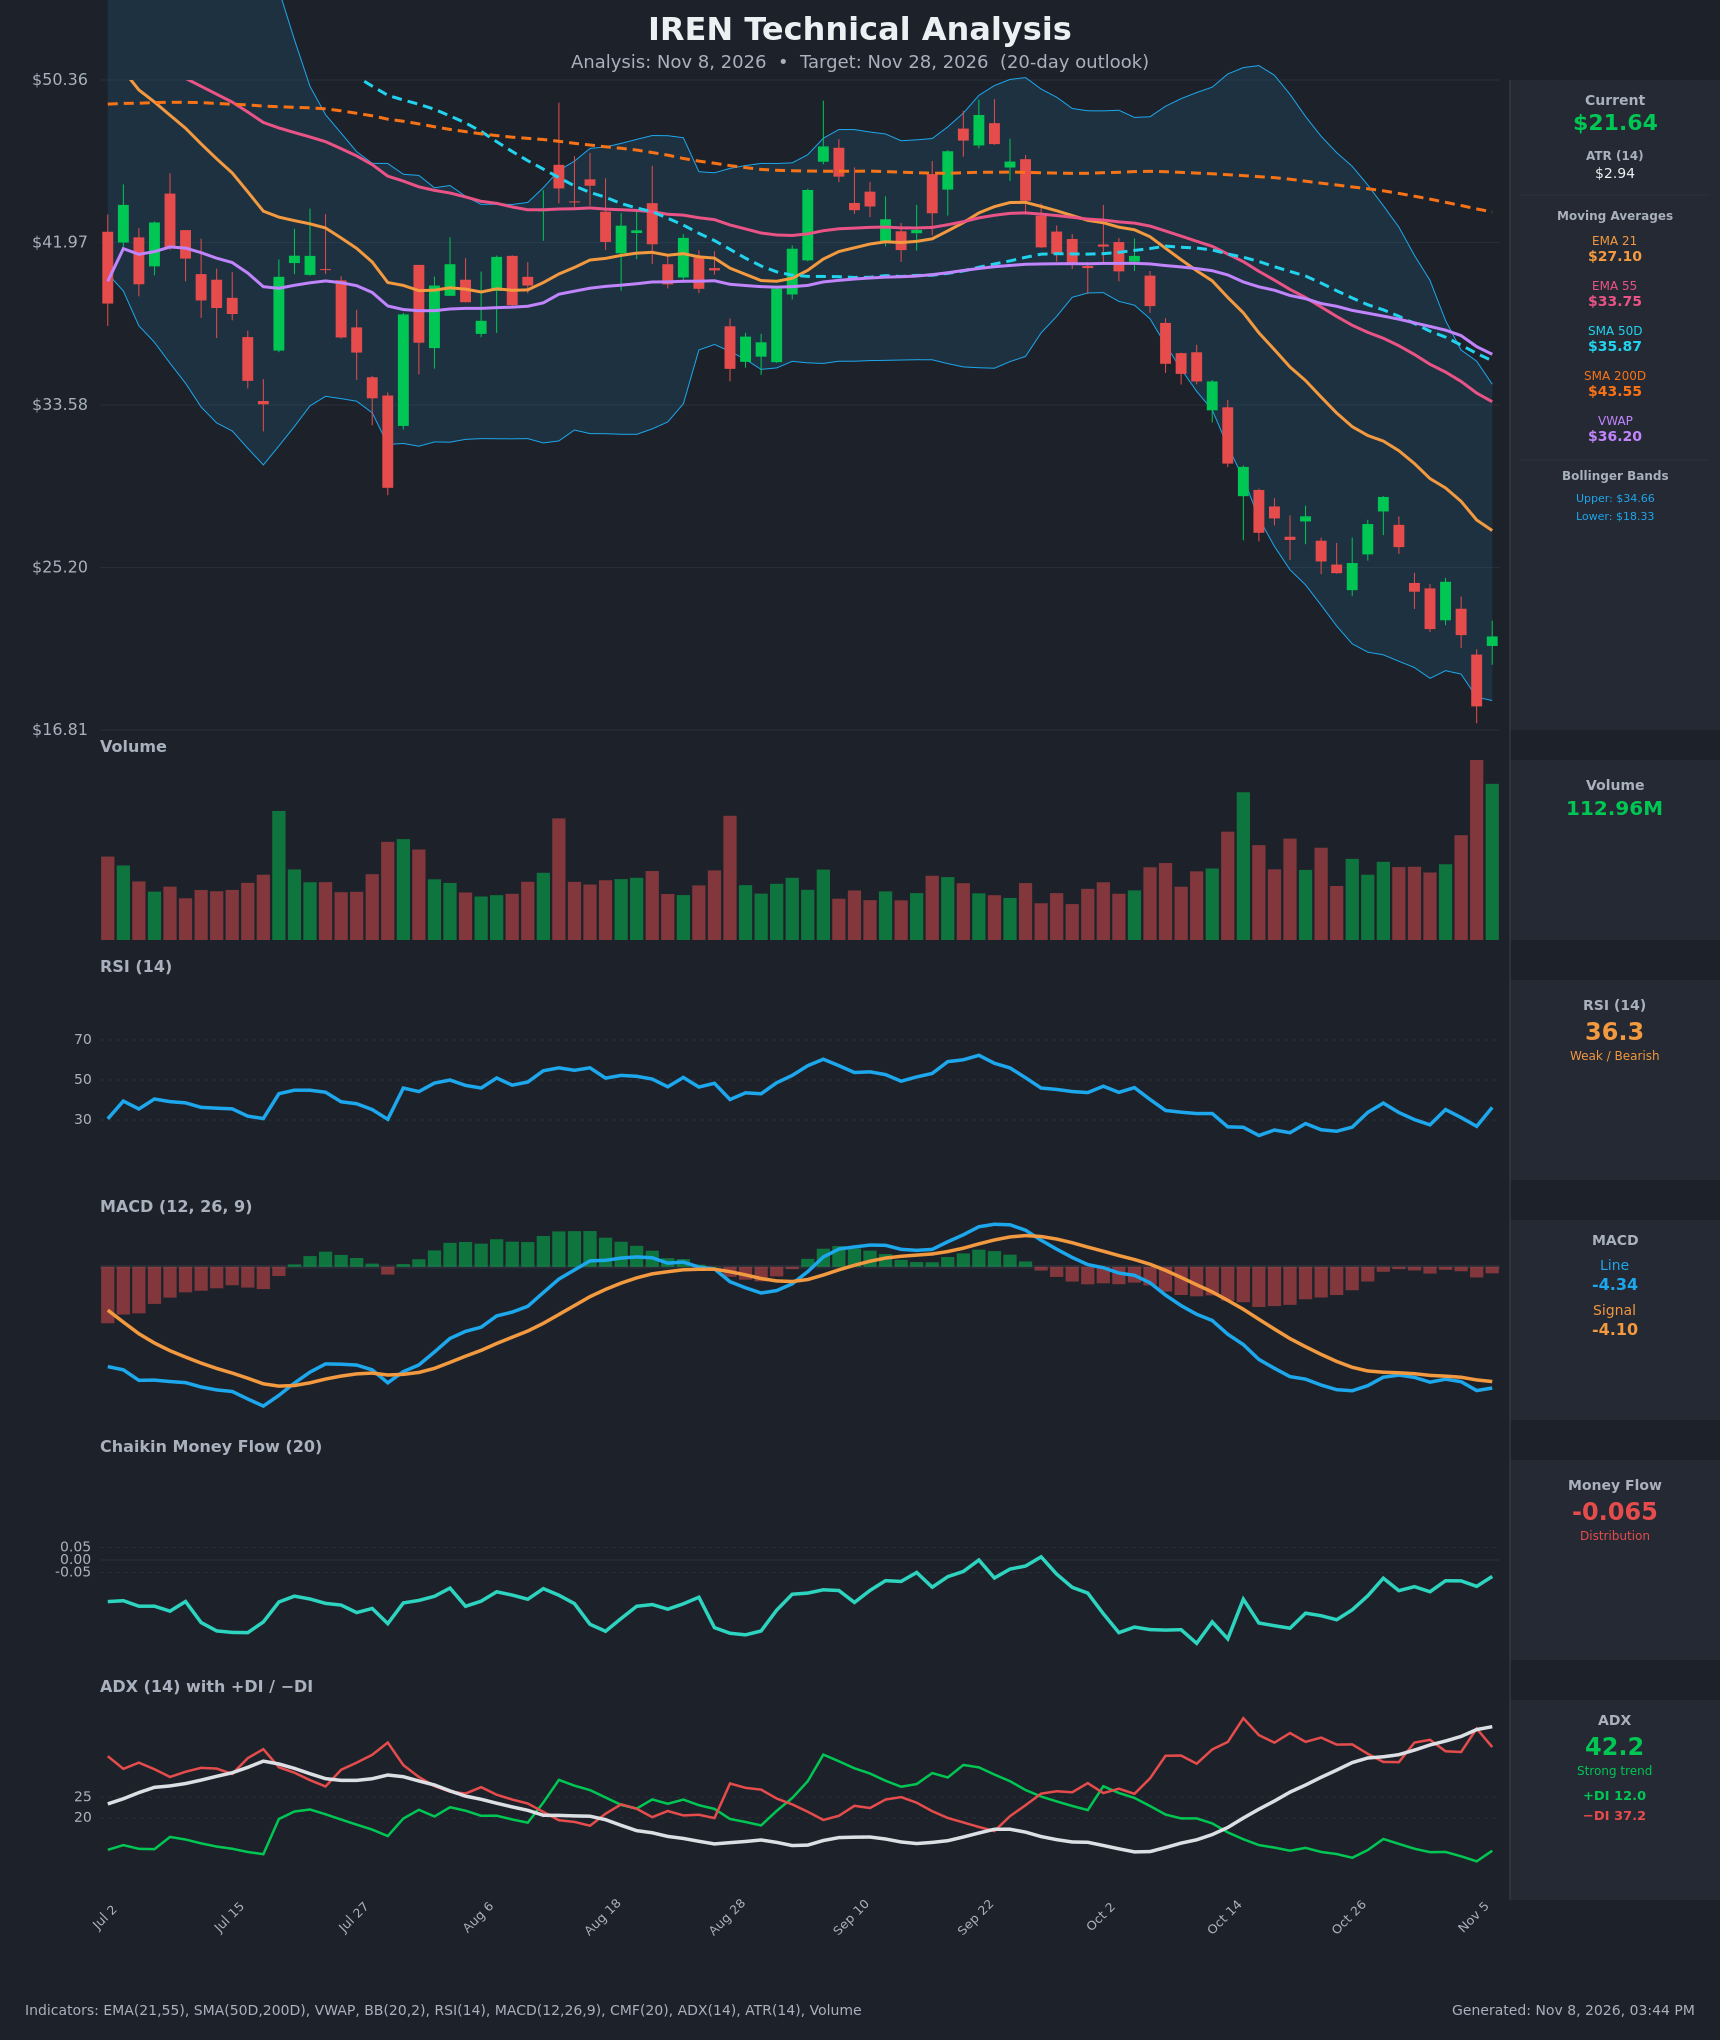
- RSI (14): 36.3, up from 26.8 on Nov 5 but still below 40 in a persistent bearish regime. The oscillator has stayed between about 24 and 38 for three weeks and has not reclaimed 50. The latest reading reflects a one-day bounce, not a momentum shift. [Bearish]
- 20 EMA (EMA 21): $27.10, about 25% above price, and falling by roughly $0.5-1.0 per day. EMA 55 ($33.75) sits well above it. Price has been below the EMA 21 since mid-October, so it acts as dynamic resistance. [Bearish]
- MACD: Line -4.335 vs signal -4.103, a histogram of about -0.23. The line is below the signal and both are deeply negative. The histogram has been shrinking and the line has been roughly flat near -4.0 to -4.4 since Oct 23. That points to downside momentum that is stalling but has not turned. [Bearish]
- Bollinger Bands (20): Upper $34.66, lower $18.33, with a midline near $26.50. The bands are very wide. Price tagged the lower band on Nov 5 (low $18.03, close $18.03) and bounced to $21.64, still in the lower third. A sustained "band walk" has defined this decline. [Bearish]
- CMF (20): -0.065, just below the -0.05 distribution threshold. It has improved from -0.27 on Oct 19 but has not turned positive. Selling pressure is easing, not reversing. [Distribution]
- ADX (14): 42.2 and rising every day for three weeks, with -DI at 37.2 well above +DI at 12.0. This is a strong, mature downtrend with sellers firmly in control. An ADX above 40 can also signal late-stage trend exhaustion. [Strong Trend - Bearish]
- Volume: 112.96M on the Nov 6 green candle, following an even heavier red capitulation bar on Nov 5. Volume has expanded sharply during the decline. The heavy down-volume washout followed by a high-volume bounce shows an attempted bottom, but the bounce has not yet been confirmed by follow-through. [Capitulation / Bounce Attempt]
DIVERGENCES & TRENDS
- Bullish divergences (secondary): On Nov 5 price made a new low ($18.03, vs $22.02 on Nov 2), while RSI (26.8 vs 23.6 on Oct 20) and CMF (-0.105 vs -0.27 on Oct 20) held at higher levels. MACD made only a marginal new low. These suggest selling is losing efficiency and favor a relief bounce.
- Trend structure: Price is below EMA 21, EMA 55, SMA 50D, SMA 200D and VWAP, in a full bearish stack (21 < 55 < 50D < 200D). The death cross (SMA 50D below SMA 200D) is already in place and both averages are falling.
- MACD: The line has been below the signal for the whole 15-bar window, with no bullish cross. The gap is narrowing (-0.23 histogram), so watch for a cross attempt.
- DI/ADX: -DI has dominated +DI since mid-October with no sign of a crossover. ADX has climbed from 24 to 42.
- Candles: The long lower shadow and big green candle on Nov 6 are a possible hammer/reversal signal. A single bar after a 60%+ decline from the $50 area does not change the trend without confirmation.
CHART PATTERNS
- Primary: Bearish continuation / descending channel. From about $45 in late September, price has made a clean series of lower highs and lower lows. The Oct 26 to Nov 4 consolidation between roughly $22 and $29 resembles a Bearish Flag/Pennant. Its breakdown on Nov 5 (to $18.03) has a measured-move target well below the current level.
- Secondary: Potential Bullish Falling Wedge. The Nov 5 low pierced the lower Bollinger Band and reversed. A bullish reversal would require a close above about $24.50 (the Nov 3 close and prior lower high) and then the $25-27 area, where EMA 21 sits.
- Resistance overhead is stacked at $24.50, $27.10 (EMA 21), $33.75 (EMA 55) and $35.87 (SMA 50D), so any rally faces heavy supply.
POTENTIAL SCENARIOS
- Scenario 1: Bearish Trend Continuation / Failed Bounce — The Nov 6 bounce is a dead-cat bounce. Price fades into resistance near $23-24.50 and rolls over under the falling EMA 21 and the heavy -DI dominance. Trigger: a daily close below about $20.00, then below $18.03. Target: $19.00-$20.00 within the window, with an extension to $16-17 if $18.03 breaks. Invalidation: a daily close above $24.50 with +DI turning up. (50% probability)
- Scenario 2: Bullish Relief Rally / Oversold Mean Reversion — Capitulation volume, divergences in RSI and CMF, and a lower-band reversal lead to a sharp bounce. Trigger: a close above $23.50-$24.50 on solid volume and a MACD bullish cross. Target: $26.50-$27.10 (the Bollinger midline and EMA 21). Invalidation: a close below $18.03. (35% probability)
- Scenario 3: Neutral Base-Building Range — Price stabilizes between $18 and $24 as selling exhausts but buyers fail to reclaim EMA 21. Trigger: contracting volume and an ADX roll-over. Target: $20-$23 chop. Invalidation: a close outside $18.00-$24.50. (15% probability)
PRICE TARGETS
- Target Price: $20.10 (20-day horizon, Nov 28)
- Expected Range: $18.90 to $21.70 (width $2.80 ≈ 12.9% of the current price, consistent with the 14-21 day guidance). The ATR of $2.94 is large relative to this range, so realized volatility could exceed it in either direction.
- Key Levels: Support at $18.03, Resistance at $24.50
OVERALL BIAS
OVERALL BIAS: BEARISH - A strong, rising ADX (42.2) with -DI far above +DI, a full bearish moving-average stack, a negative MACD and distribution-level CMF favor continuation lower. Conviction is modest because RSI/CMF divergences and the high-volume bounce off the lower Bollinger Band leave room for a relief rally toward $24-27.
This is educational analysis and not financial advice.