MSTR 20-day bearish forecast — Nov 8, 2026
- Bias: Bearish
- Timeframe: 20 days (made Nov 8, 2026, target date Nov 27, 2026)
- Price at analysis: $128.93
- Price target: $124.50
- Expected range: $119.50 – $134.00
- Result: Pending — graded after the close on Nov 27, 2026
Get a free AI analysis of MSTR today
Analysis
TECHNICAL INDICATORS
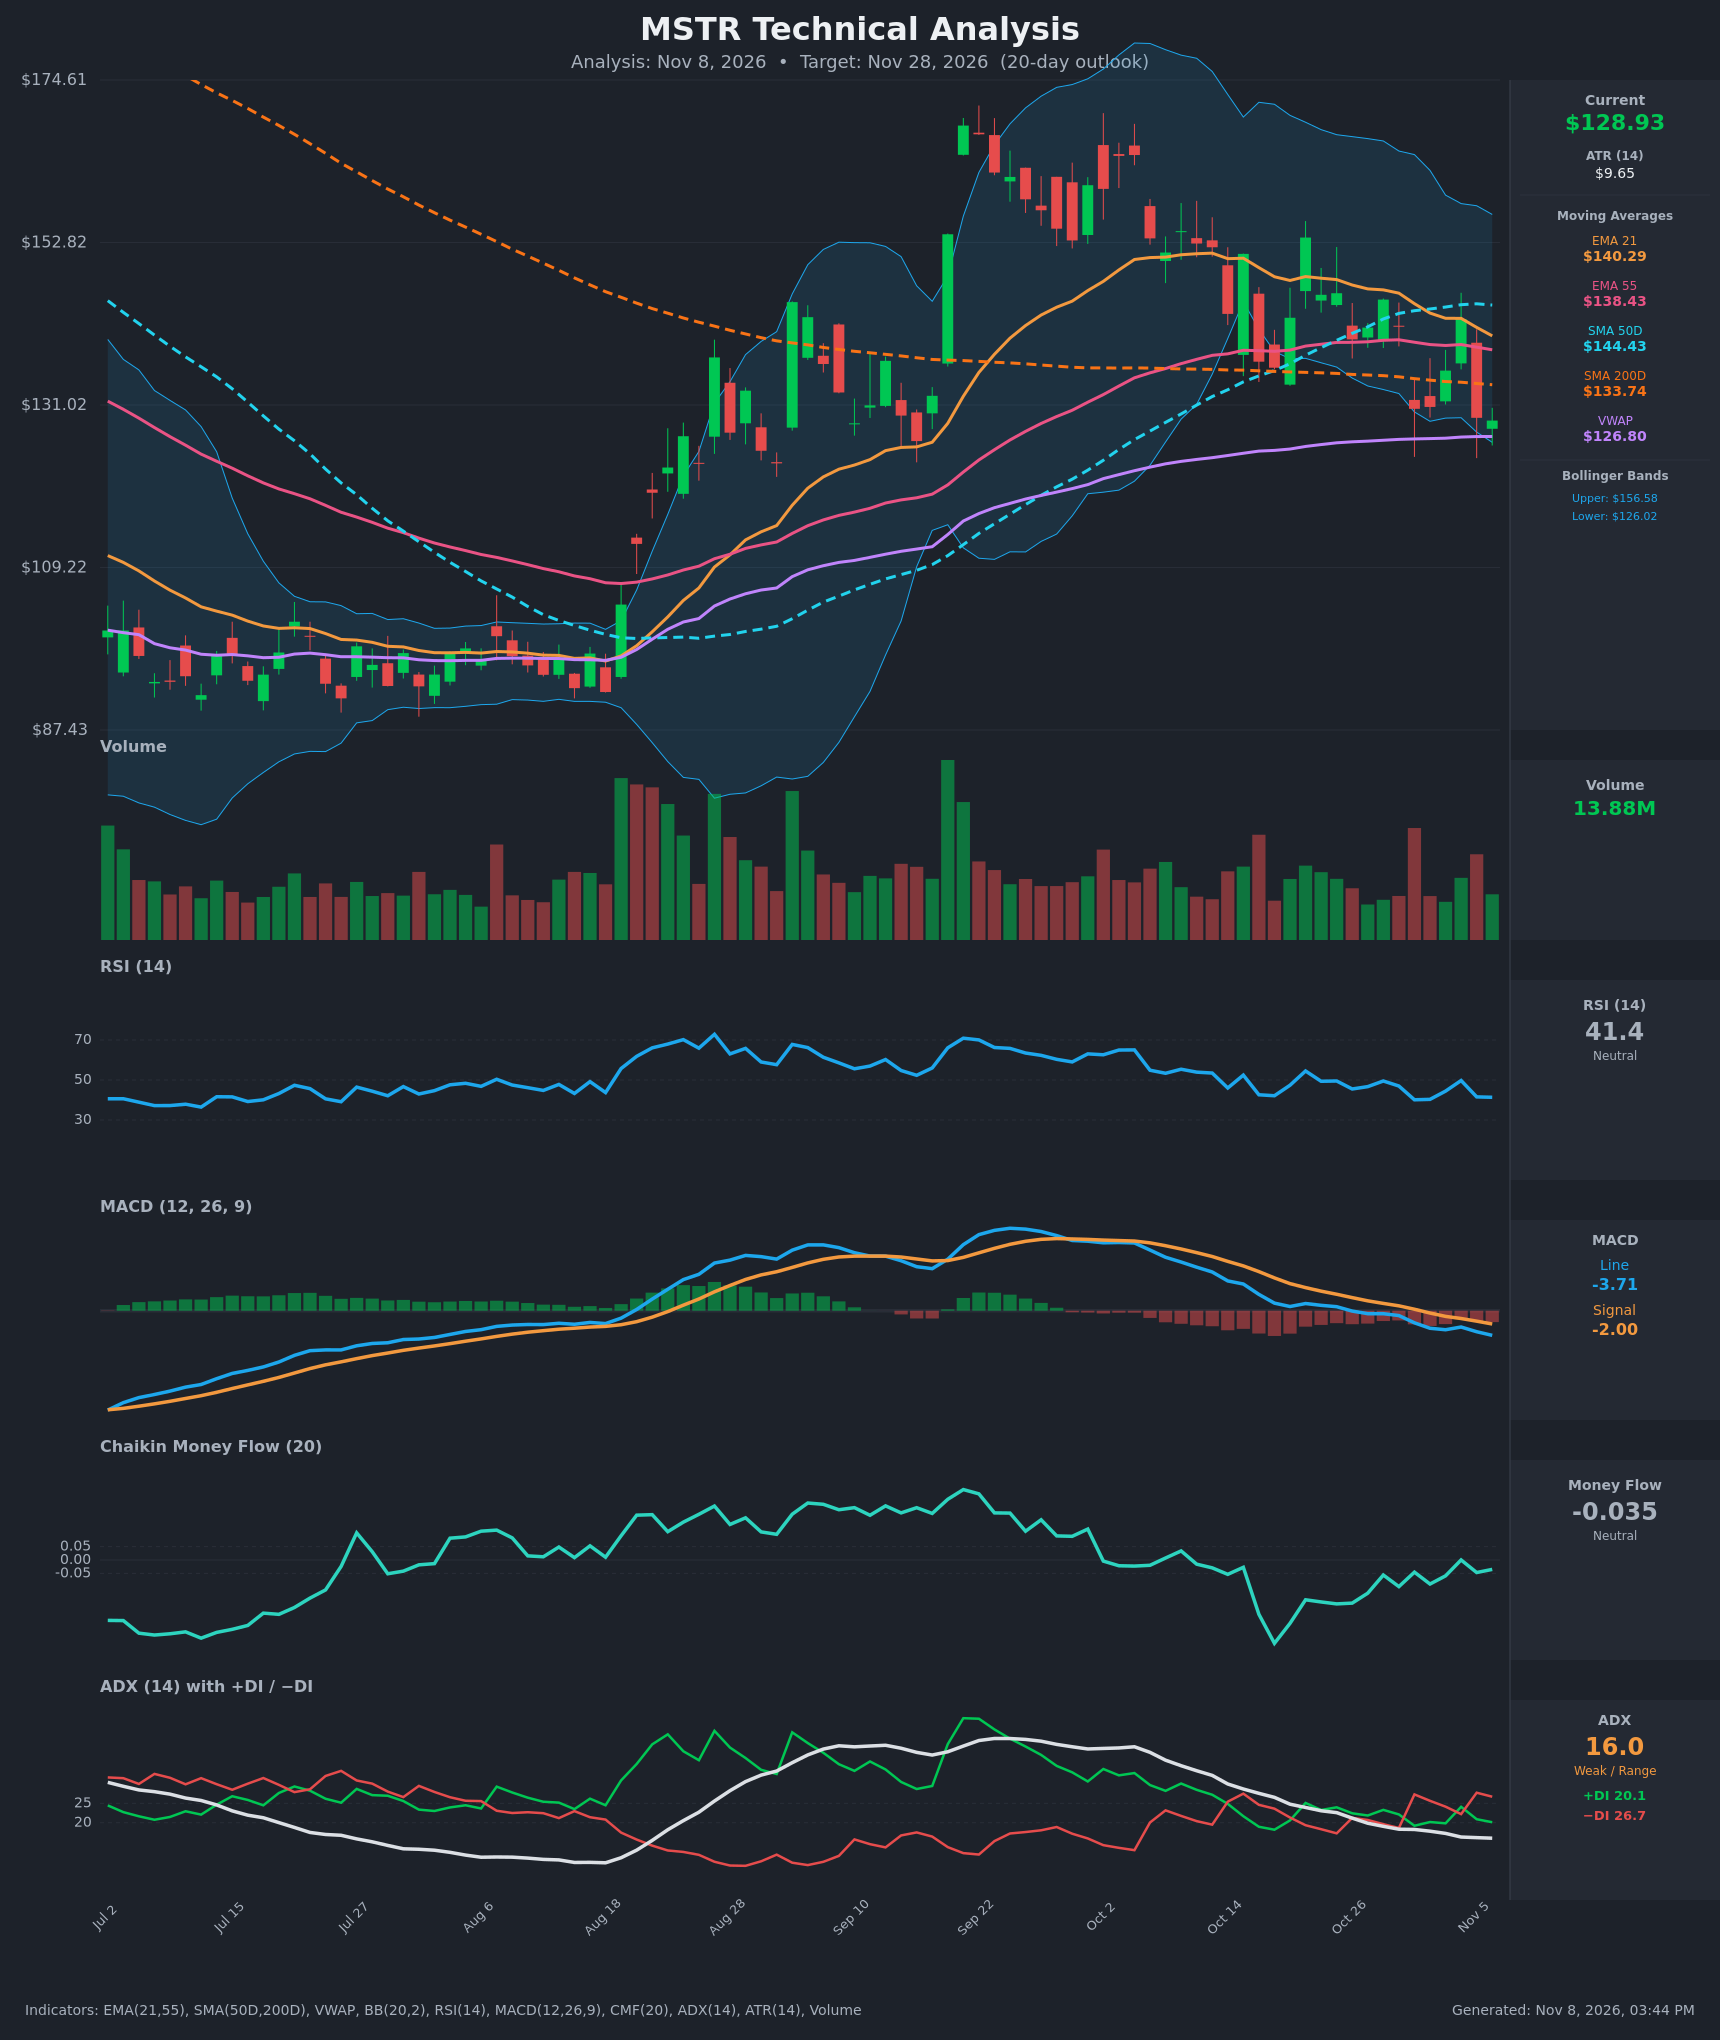
- RSI (14): 41.35, below the 50 midline but not oversold. It has been capped in the 40-50 zone since early October, with a lower-high sequence (about 54 → 49.7 → 41.4). Momentum is weak but not washed out, so there is room to fall further. [Bearish]
- 20 EMA: The EMA 21 is $140.29 and falling (from $148.2 on Oct 19). Price at $128.93 is about 8% below it, so the EMA acts as overhead resistance. The EMA 55 at $138.43 is also above price and now flattening or rolling over. EMA21 is converging toward EMA55 and nearing a bearish cross. [Bearish]
- MACD: The line at -3.71 is below the signal at -2.00 after a bearish cross around Oct 26-30. The histogram is negative and widening (about -1.7), and both lines are below zero and sloping down. Momentum is clearly deteriorating. [Bearish]
- Bollinger Bands (20): The lower band is $126.02 and the upper band is $156.58. Price sits in the bottom ~8% of the band range, near the lower band. The bands are contracting after the September expansion. A touch of the lower band can produce a bounce, but a close below it in a downtrend often leads to a band walk. [Neutral]
- CMF (20): -0.035, between the ±0.05 thresholds. It has recovered from the deeply negative readings of mid-October (about -0.31) but has failed to turn positive, so buyers are not stepping in with conviction. [Neutral]
- ADX (14): 16.0, below 20 and falling (26.6 → 16.0), so trend strength is weak. −DI (26.7) is above +DI (20.1), after a bearish DI crossover on Oct 30 and again on Nov 5. Direction favors bears, but the weak ADX limits conviction and suggests choppy trade. [Weak Trend, bearish lean]
- Volume: 13.88M, moderate and below the spike volumes seen on the Sep and Oct rallies. The largest recent red-volume bar was the Oct 30 drop, with only modest buying on the bounces. Sell-offs have drawn heavier volume than rallies. [Mildly Bearish]
Moving-average context:
- Price is below the EMA21, EMA55 and SMA50D ($144.43) and just below the SMA200D ($133.74). The SMA200D sits about 3.7% overhead and is the first major resistance.
- The SMA50D is above the SMA200D, so the golden cross is still intact. The SMA50D has started to flatten and roll over, which warns of fading trend support.
- Price is above VWAP ($126.80) by about 1.7%, which is the only moving-average-type support nearby.
DIVERGENCES & TRENDS
- No clear bullish divergence. RSI and price are both making lower highs and lower lows, so momentum confirms price.
- Trend: Lower highs from the September peak (~$167 → ~$153 → ~$145 → ~$142) show a clear distribution and downtrend structure.
- Crossovers:
- The MACD bearish cross is in place and widening.
- −DI crossed back above +DI.
- Price lost the EMA21 and EMA55 on Nov 5.
- EMA21 is converging toward EMA55 and SMA50D is flattening.
- Offsetting factors:
- CMF has improved from its October lows.
- Price is pressing the lower Bollinger Band, VWAP and the ~$126-130 demand zone, where buyers have stepped in repeatedly (Oct 30, Nov 5, Nov 6).
- ADX at 16 suggests a drifting market rather than an impulsive sell-off.
CHART PATTERNS
- Descending Triangle (bearish continuation): Lower highs from ~$153 (Oct 21) down to ~$142 (Nov 4) press against a horizontal support zone around $126-130. A decisive close below ~$126 (the lower band and the recent wick lows) would confirm the breakdown. The measured move (~$16 triangle height) points toward the ~$110 area, which is beyond this 20-day window, so I expect only a partial move (~$120-$124).
- Bearish Rising Wedge (reversal) / Bearish Flag: The late-October to early-November bounces from $130 to $145 look like a weak counter-trend rally that failed at the EMA21. This is consistent with the bearish continuation structure.
- Invalidation of the pattern: A close back above the SMA200D ($133.74) and then the EMA21/EMA55 ($138-140) would negate the descending triangle and open a squeeze toward the SMA50D at ~$144.
POTENTIAL SCENARIOS
- Scenario 1: Bearish Breakdown of the $126-130 Support — Price fails to hold the lower Bollinger Band and VWAP, MACD histogram keeps expanding negative, and −DI stays on top. Sellers push toward the next support zone. Trigger: daily close below $126.00 (lower BB and VWAP). Target: $120-$124, with extension toward $115. Invalidation: daily close above $134 (SMA200D). (50% probability)
- Scenario 2: Neutral Range Chop — With ADX at 16, price oscillates between $126 support and $134-$138 resistance, and indicators reset without a trend. Trigger: holds above $126 with a CMF turn above 0. Target: $126-$135 range. Invalidation: a close outside $124-$138. (25% probability)
- Scenario 3: Bullish Oversold Bounce / Reclaim — The lower band and demand zone attract buyers, and price reclaims the SMA200D and EMA55. Trigger: close above $134 with RSI back above 50 and an improving MACD histogram. Target: $140-$144 (EMA21 / SMA50D). Invalidation: close back below $126. (25% probability)
PRICE TARGETS
- Target Price: $124.50 (20-day horizon, ~Nov 28)
- Expected Range: $119.50 to $134.00 (width $14.50, about 11.2% of the current price, consistent with the 14-21 day guidance)
- Key Levels: Support at $126.02 (lower Bollinger Band / just below VWAP at $126.80, then ~$120), Resistance at $133.74 (SMA200D; then $138.43-$140.29 EMA55/EMA21)
OVERALL BIAS
OVERALL BIAS: BEARISH - Price is below the EMA21, EMA55 and SMA50D, MACD is in a widening bearish cross, −DI leads +DI, and lower highs form a descending-triangle structure over the $126-130 support. Conviction is modest because ADX is weak (16), CMF is neutral, and price is already at the lower Bollinger Band, so a bounce toward $134 is possible before further downside.
This is educational analysis and not financial advice.