NIO 20-day bullish forecast — Nov 8, 2026
- Bias: Bullish
- Timeframe: 20 days (made Nov 8, 2026, target date Nov 27, 2026)
- Price at analysis: $3.39
- Price target: $3.50
- Expected range: $3.18 – $3.58
- Result: Pending — graded after the close on Nov 27, 2026
Get a free AI analysis of NIO today
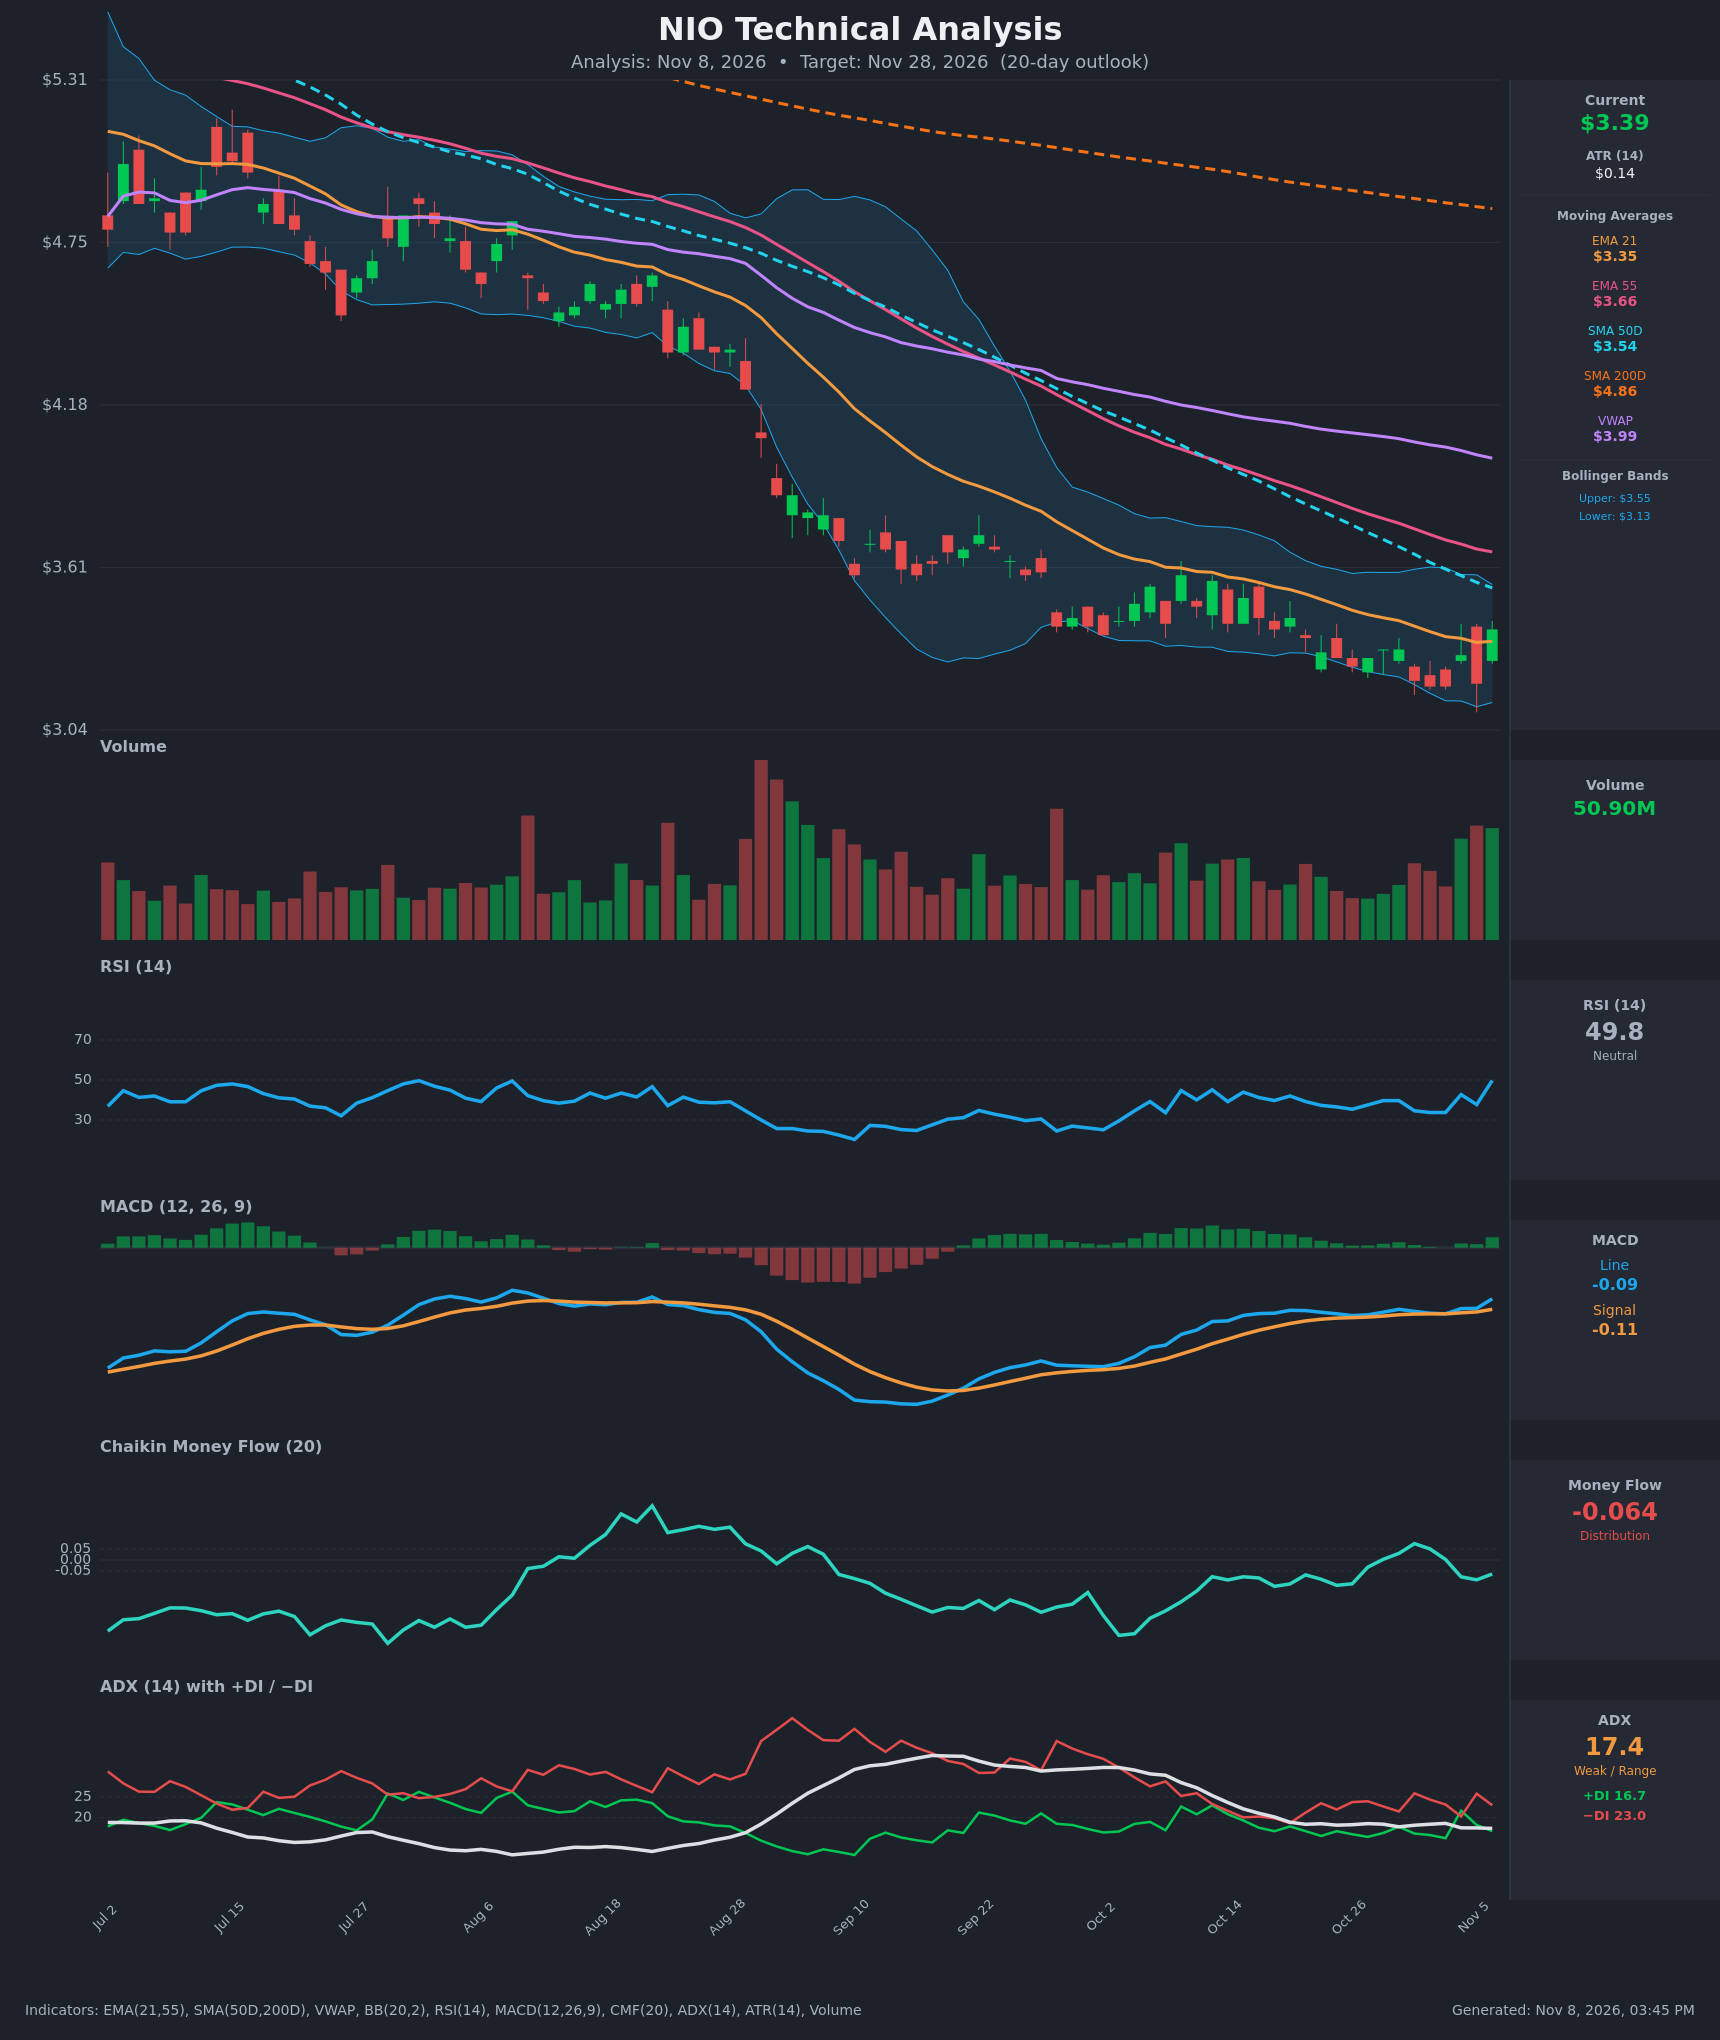
Analysis
TECHNICAL INDICATORS
- RSI (14): 49.76, a sharp jump from 37.7 the day before and from the 33.7 low on Nov 2-3. It has moved out of oversold territory and is now at the neutral midline with momentum rising. [Bullish]
- 20 EMA (EMA 21 = $3.3487): Price at $3.39 closed back above the EMA 21 after trading below it for most of the past month. This is a first reclaim and not yet confirmed support. EMA 55 ($3.66) and SMA50D ($3.54) are still overhead as resistance. [Neutral]
- MACD: Line at -0.090 is above the signal at -0.108, and the histogram has turned slightly positive. The line crossed back above the signal on Nov 4-6 after weeks of hugging it, but both are still below zero, so this is a weak, early recovery signal. [Bullish]
- Bollinger Bands (20): Upper $3.5477, lower $3.1343, mid-band about $3.34. Price bounced from the lower band (the Nov 5 low sits near it) and closed above the mid-band. The bands are narrow and contracting, which fits a low-volatility base. The $3.55 upper band is the first upside test. [Bullish]
- CMF (20): -0.064 is just below the -0.05 threshold. It was positive (+0.075) in late October but has rolled back into mild distribution. [Distribution]
- ADX (14): 17.4 with −DI (23.0) above +DI (16.7). The trend is weak and range-bound, with a bearish lean. The ADX has faded from its September peak, so selling pressure is easing but bears still hold the edge. [Weak Trend, bearish lean]
- Volume: 50.90M on the latest green candle, among the highest readings in the last two months and well above the recent average. A high-volume up day at a support zone suggests buyers are stepping in. [Bullish]
DIVERGENCES & TRENDS
- Long-term structure is bearish. Price is below SMA200D ($4.86), SMA50D ($3.54), EMA 21 and EMA 55 (EMA 21 < EMA 55). The SMA50D is under the SMA200D, so the death cross is already in place. VWAP at $3.99 is far above price.
- Weak momentum divergence: Price made lower lows in late October and early November, around $3.19-$3.21. The MACD line stayed flat at about -0.11 to -0.12, and the RSI low of 33.7 was not far below the late-October low of 34.6. Selling momentum is fading, which is a mild bullish divergence rather than a strong one.
- Crossover: The MACD line has crossed above its signal line. The EMA 21/55 and SMA 50/200 relationships remain bearish, with no bullish MA crossovers.
- DI: −DI has stayed on top since Oct 21 except for a brief +DI spike on Nov 4. There has been no sustained bullish DI crossover.
- Price action: Price held $3.19-$3.20 on three tests (Nov 2, Nov 3, Nov 5), then closed with a strong green candle at $3.39.
CHART PATTERNS
- Bullish Double Bottom: The $3.19-$3.20 lows form a small double (or triple) bottom, with the neckline near $3.30-$3.43. A close at $3.39 puts price at the neckline. The measured move is about $0.20-$0.25 above the neckline, which points to $3.55-$3.65.
- Bullish Falling Wedge / downtrend channel: The multi-month decline has narrowed into converging lower highs and lower lows, with contracting Bollinger Bands. This fits a falling wedge, with a breakout target near the SMA50D/EMA 55 zone at $3.54-$3.66.
- Caveat: The broader trend is still down, so any reversal needs to clear $3.55 (SMA50D and upper Bollinger Band). Until then it is a bounce inside a downtrend, and a loss of $3.19 would negate both patterns.
POTENTIAL SCENARIOS
- Scenario 1: Bullish Double-Bottom Bounce — Price holds above the EMA 21 and the $3.19 base. The MACD recovery continues and RSI pushes above 50, pulling price up toward the SMA50D and upper Bollinger Band. Trigger: daily close above $3.43 with sustained volume. Target: $3.50-$3.58, with an extension to $3.66 (EMA 55). Invalidation: daily close below $3.28. (50% probability)
- Scenario 2: Bearish Downtrend Resumption — The bounce stalls below $3.55 resistance. The downtrend, −DI dominance and negative CMF win out, and price breaks the $3.19 double bottom. Trigger: rejection at $3.50-$3.55, then a close below $3.19. Target: $3.00-$3.10. Invalidation: close above $3.58. (30% probability)
- Scenario 3: Neutral Range Consolidation — With ADX below 20, price chops between $3.19 and $3.50 without a decisive break. Trigger: failure to break either $3.19 or $3.55 over the period. Target: $3.30-$3.42. Invalidation: a close outside $3.15-$3.58. (20% probability)
PRICE TARGETS
- Target Price: $3.50 (20-day horizon, about +3.2% from $3.39)
- Expected Range: $3.18 to $3.58. Width is $0.40, or about 11.8% of the current price, which fits the 14-21 day guidance of 8-12%.
- Key Levels: Support at $3.20 (double-bottom lows), Resistance at $3.55 (SMA50D / upper Bollinger Band)
OVERALL BIAS
OVERALL BIAS: BULLISH - Price bounced from a $3.19-$3.20 double bottom on high volume, reclaimed the EMA 21, and the MACD has crossed up with RSI recovering to 50. Upside is likely capped near $3.55-$3.66 by the declining SMA50D and EMA 55. The long-term downtrend, negative CMF and −DI dominance keep conviction modest.
This is educational analysis and not financial advice.