PFE 20-day bearish forecast — Nov 8, 2026
- Bias: Bearish
- Timeframe: 20 days (made Nov 8, 2026, target date Nov 27, 2026)
- Price at analysis: $29.39
- Price target: $28.85
- Expected range: $27.50 – $30.40
- Result: Pending — graded after the close on Nov 27, 2026
Get a free AI analysis of PFE today
Analysis
TECHNICAL INDICATORS
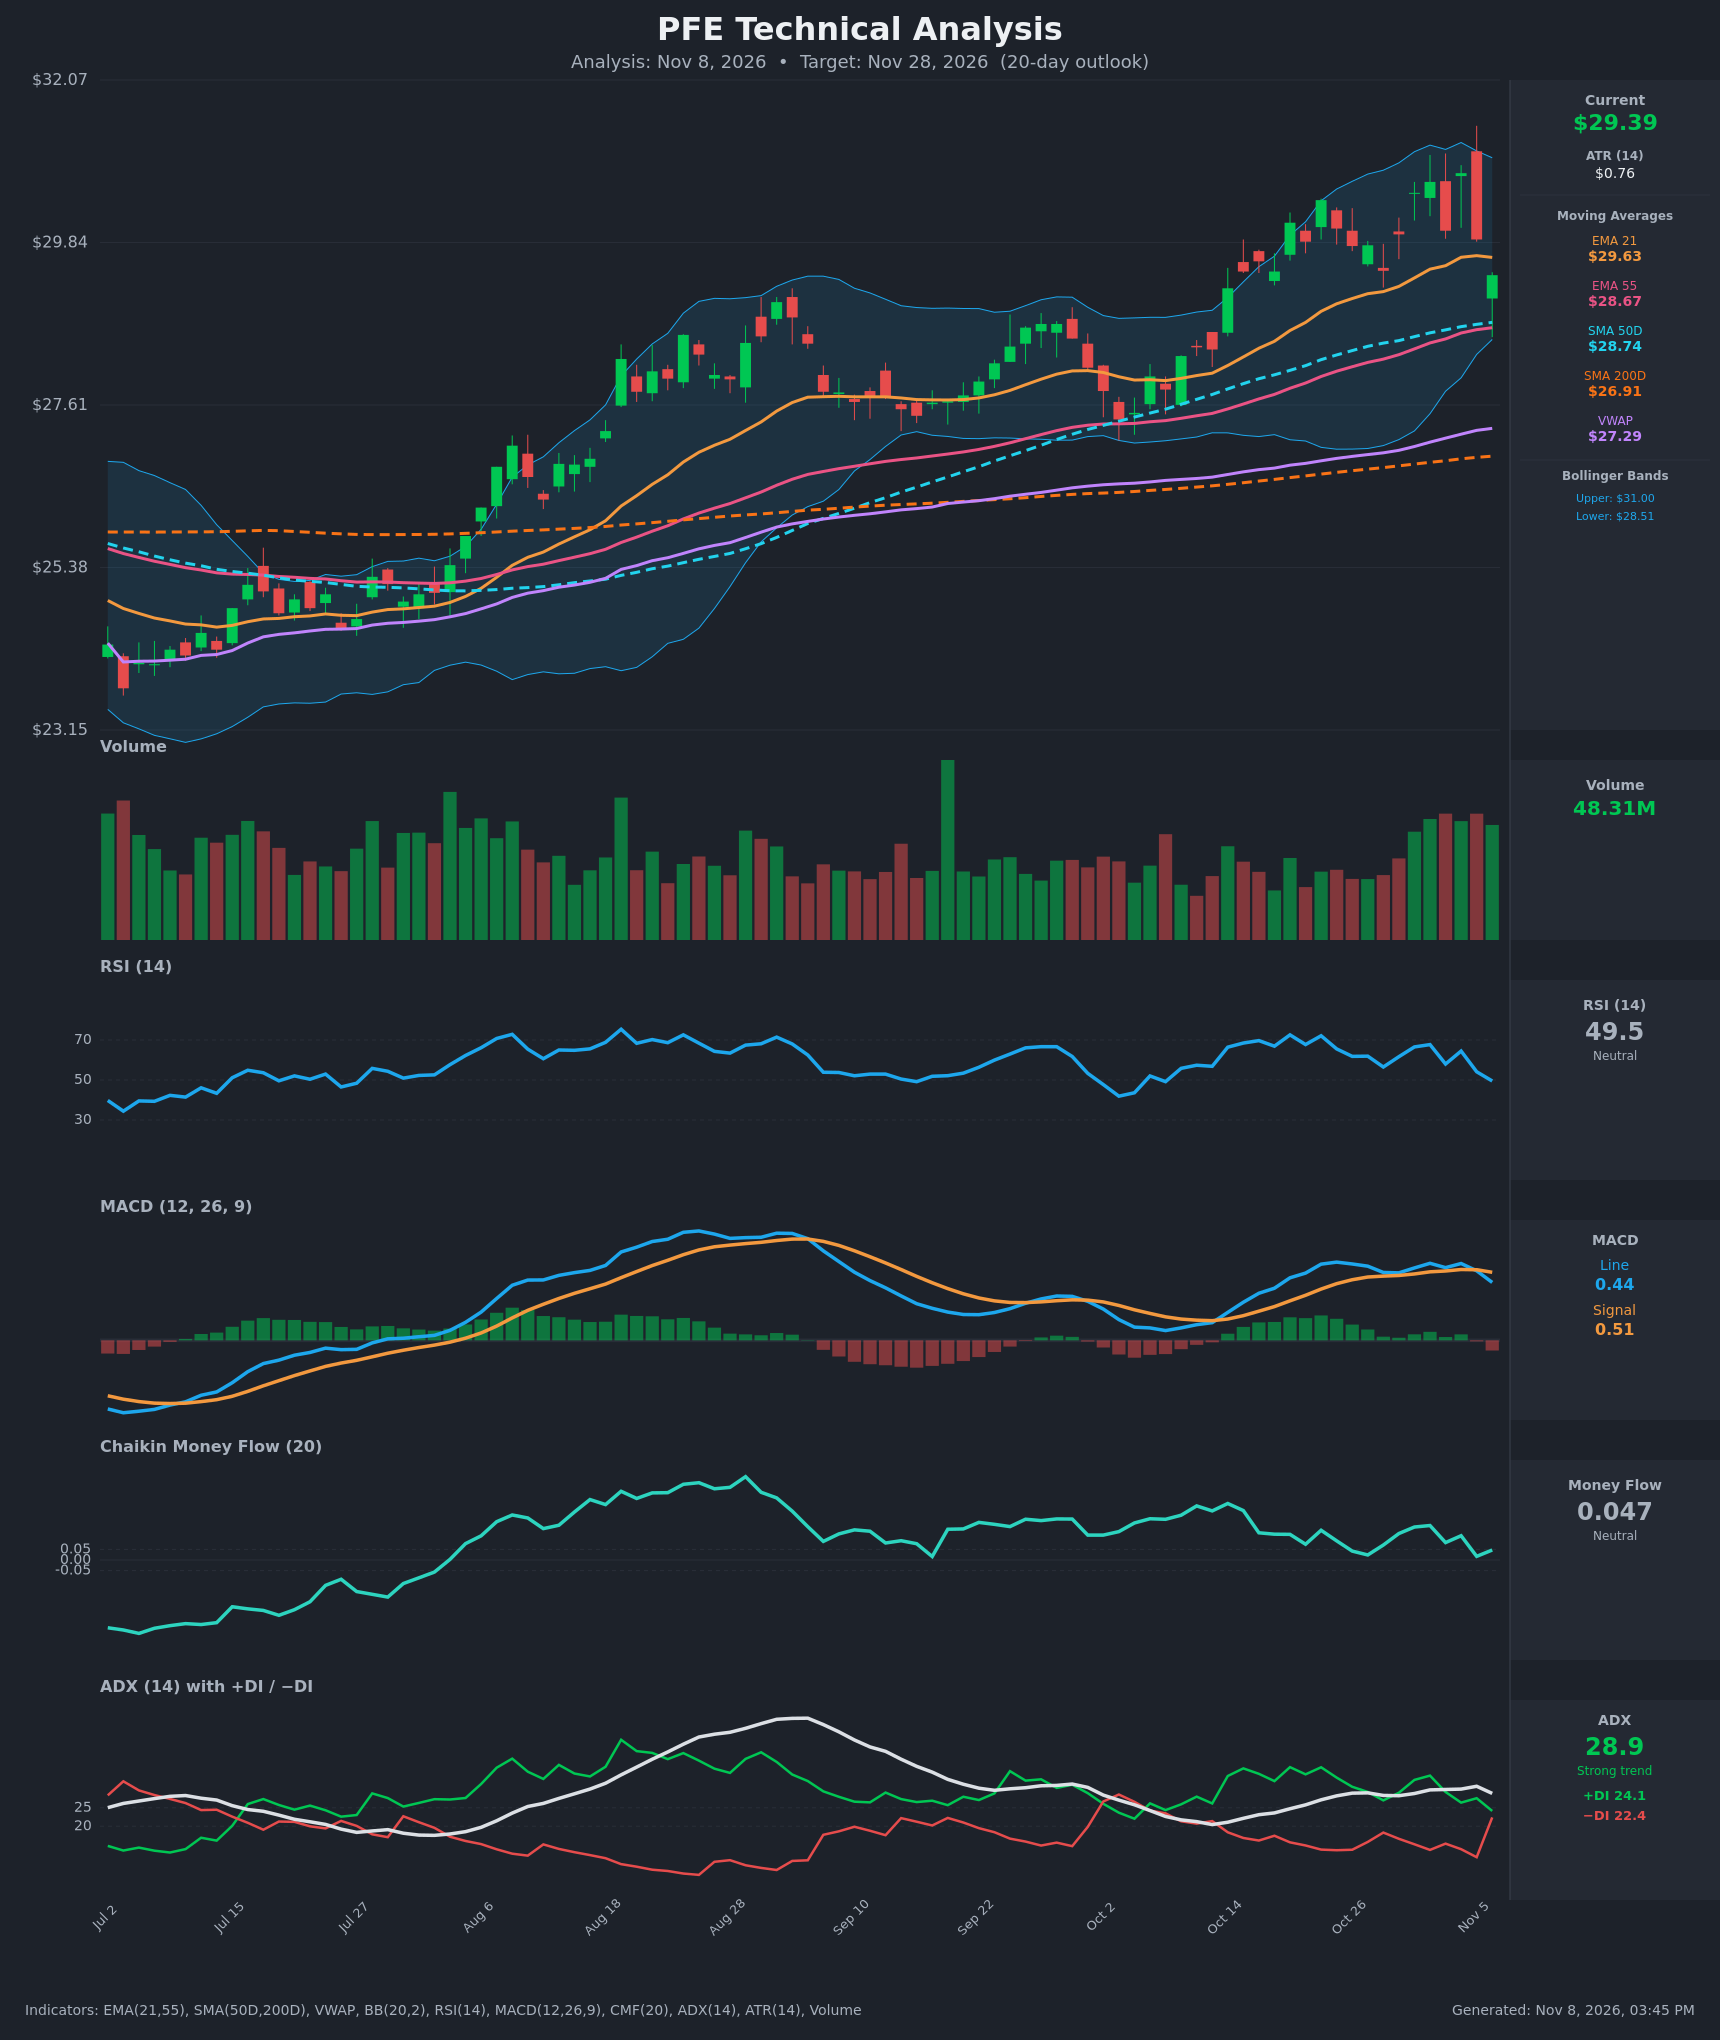
- RSI (14): 49.51, down sharply from 66.5-67.7 on Oct 30 - Nov 2 and 64.5 on Nov 4. It has lost the 50+ momentum zone and is rolling over, with no oversold bounce signal yet. [Bearish]
- 20 EMA (EMA 21): $29.63. Price at $29.39 closed below it for the first time in this leg higher, so it now acts as near-term resistance. EMA21 is still above EMA55 ($28.67) and rising, so the structure is intact. [Bearish]
- MACD: Line 0.437 against Signal 0.514, a fresh bearish crossover on Nov 6. The line is turning down from a flat peak near 0.58 and the histogram is slightly negative (-0.08). The MACD never expanded much on the recent highs, which signals fading momentum. [Bearish]
- Bollinger Bands (20): Upper $31.00, lower $28.51, midline about $29.75. Price has slipped below the midline after repeated failures near the upper band ($30.5-30.8 area). The bands are wide, so volatility is elevated. The next band support is about $28.51. [Bearish]
- CMF (20): 0.047, at the neutral edge. It has faded from 0.164 on Nov 2 and has been oscillating between 0.02 and 0.16. Accumulation is weakening. [Neutral]
- ADX (14): 28.9 with +DI 24.1 and −DI 22.4. The trend is still strong in absolute terms, but +DI has collapsed from 36 and −DI has jumped from 11.6 to 22.4 in one bar. A bearish DI crossover is imminent. [Strong Trend, Bullish but deteriorating]
- Volume: 48.31M, elevated versus the prior months. The recent high-volume sessions included heavy red candles (the rejection from $31.8 intraday and the drop to $29.39), which points to supply entering near the highs. [Mild distribution]
Longer-term context remains bullish:
- Price is above the SMA50 ($28.74), SMA200 ($26.91) and VWAP ($27.29).
- The SMA50 is well above the SMA200 (golden cross long established).
DIVERGENCES & TRENDS
- Momentum divergence: Price made higher highs ($30.42 → $30.52 → $30.67 → $30.79) while the MACD line stalled around 0.55-0.59, and RSI peaked at 72.6 on Oct 20 and 72.1 on Oct 22 and did not exceed 67.7 on the later highs. This is a mild bearish divergence.
- CMF trend: The CMF peak of 0.164 is declining, and ADX is rolling over from 30.8, so the trend is losing strength.
- Crossovers:
- The MACD crossed below its signal on Nov 6 (bearish).
- Price closed below EMA21 for the first time since mid-October.
- A DI crossover is nearly complete (+DI 24.1 vs −DI 22.4).
- EMA21 is still above EMA55, and the SMA50 is above the SMA200.
- Pullback levels: The cluster of EMA55 ($28.67), SMA50 ($28.74) and the lower Bollinger Band ($28.51) is the logical downside magnet, roughly $0.65-0.90 below the current price.
CHART PATTERNS
- Bearish Triple Top / rectangle (reversal): Highs repeat at roughly $30.4-30.8 (Oct 22, Oct 30, Nov 2, Nov 4), with lows around $29.4-29.5 (Oct 28, Nov 6). Price is now closing at the "neckline" (~$29.45). A confirmed break gives a measured move of about $1.3 (the pattern height), which projects to roughly $28.1. The nearer supports at $28.5-28.7 will likely slow the decline.
- Continuation view: A pullback to the rising SMA50/EMA55 would still be a normal retest within the larger uptrend (a bullish flag/higher-low structure if it holds). The pattern is not invalidated unless $28.5 breaks decisively.
- Candlesticks: The upper wicks to $31.8 and the heavy red candles suggest rejection at resistance.
POTENTIAL SCENARIOS
- Scenario 1: Bearish Pullback to Moving-Average Support — The triple-top neckline breaks, the MACD stays below its signal and the DIs cross bearishly. Price drifts toward the EMA55/SMA50 cluster and tests the lower Bollinger Band. Trigger: daily close below $29.40 followed by a close below $29.00. Target: $28.60-28.85, with an extension to $28.10 (measured move). Invalidation: daily close above $30.00 (back above EMA21 with rising MACD). (52% probability)
- Scenario 2: Bullish Trend Resumption — Buyers defend the $29.0-29.4 zone or the SMA50/EMA55, the MACD crosses back up and price retakes EMA21. Trigger: close above $29.65 (EMA21) and then $30.00. Target: $30.80 retest, with a possible break toward $31.50. Invalidation: daily close below $28.50. (33% probability)
- Scenario 3: Neutral Range Consolidation — Price chops between $28.7 and $30.3 as ADX fades and the DIs intertwine. Trigger: repeated closes between the moving-average cluster and EMA21 without a clean break. Target: about $29.4. Invalidation: close beyond $28.5 or $30.8. (15% probability)
PRICE TARGETS
- Target Price: $28.85 (20-day horizon, Nov 28, 2026)
- Expected Range: $27.50 to $30.40 (width $2.90, about 9.9% of the current price, consistent with the 14-21 day guidance of 8-12%)
- Key Levels: Support at $28.67 (EMA55, with the SMA50 at $28.74 and the lower Bollinger Band at $28.51 just below), Resistance at $29.63 (EMA21), with major resistance at $30.79 (recent swing high)
OVERALL BIAS
OVERALL BIAS: BEARISH - Price has lost the EMA21 and sits on a probable triple-top neckline. The MACD has crossed bearishly, RSI has dropped to 49.5, −DI has surged toward +DI, and CMF and volume show waning accumulation. The larger uptrend stays intact above the SMA50/200, so the likely path is a pullback toward about $28.7-28.9 rather than a collapse.
This is educational analysis and not financial advice.