QUBT 20-day bearish forecast — Nov 8, 2026
- Bias: Bearish
- Timeframe: 20 days (made Nov 8, 2026, target date Nov 27, 2026)
- Price at analysis: $6.33
- Price target: $6.05
- Expected range: $5.65 – $6.40
- Result: Pending — graded after the close on Nov 27, 2026
Get a free AI analysis of QUBT today
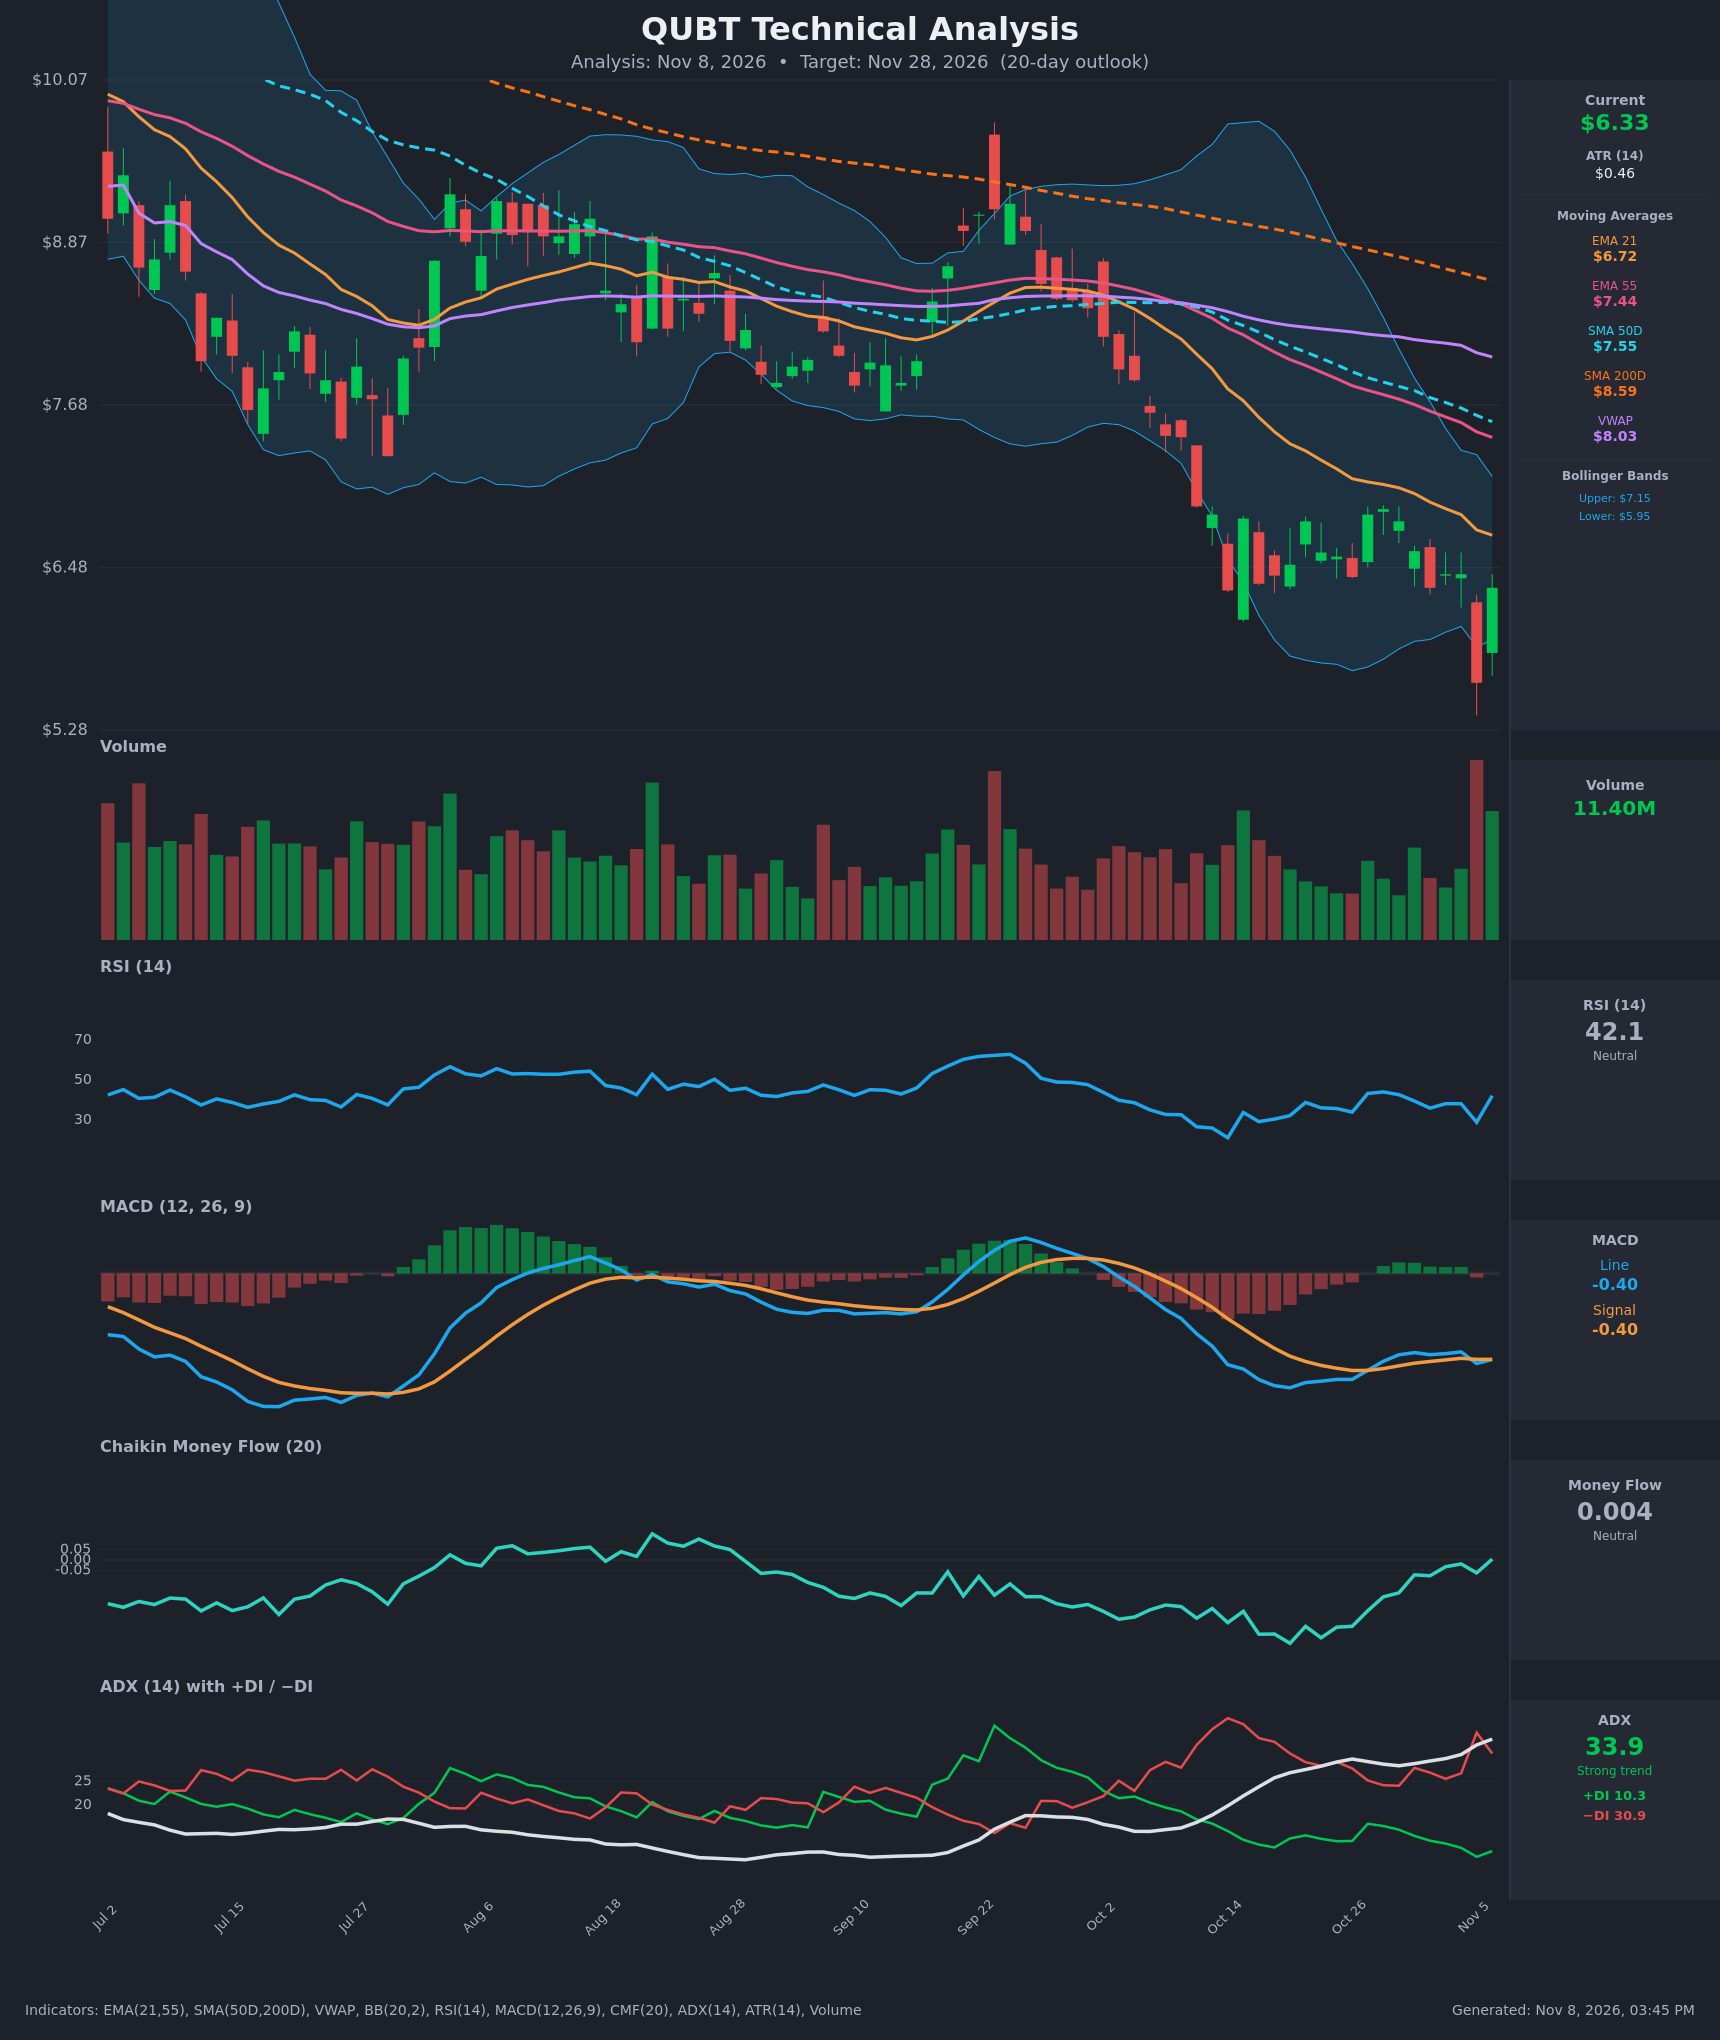
Analysis
TECHNICAL INDICATORS
- RSI (14): 42.13, bounced sharply from 28.9 (oversold) on Nov 5 but still below 50. The chart shows lower highs on RSI since the September peak near 62. Momentum is recovering from an extreme but remains in bearish territory. [Bearish]
- 20 EMA: The EMA 21 is $6.72, above the $6.33 price, so it acts as dynamic resistance. The EMA 21 is also well below the EMA 55 ($7.44) and has been falling steadily. [Bearish]
- MACD: Line -0.3957 vs Signal -0.3953, essentially flat with a histogram near zero. A bearish cross on Nov 5 was reversed the next day, and both lines sit below zero. Downside momentum is fading but no bullish signal has formed. [Neutral]
- Bollinger Bands (20): Upper $7.15, lower $5.95, mid-band about $6.55. Price is below the midline, and Nov 5 pierced the lower band before closing back inside it. The bands are narrowing after the October expansion. This suggests selling is slowing, but price is still in the lower half of the band. [Bearish]
- CMF (20): 0.004, inside the ±0.05 neutral zone. It has risen from about -0.40 on Oct 20, so selling pressure has eased substantially. Accumulation has not yet shown up. [Neutral]
- ADX (14): 33.9 and rising, with −DI 30.9 above +DI 10.3. The downtrend is strong and bears are firmly in control. −DI has pulled back from 35.3 but +DI is still very weak. [Strong Trend – Bearish]
- Volume: 11.40M on the green Nov 6 bar, after the very heavy red capitulation volume on Nov 5. The high-volume reversal candle hints at a short-term low, but one session is not confirmation. [Neutral / Tentative Relief Bounce]
DIVERGENCES & TRENDS
- Moving averages: Price ($6.33) is below the EMA 21 ($6.72), EMA 55 ($7.44), SMA 50D ($7.55), SMA 200D ($8.59) and VWAP ($8.03). The SMA 50D is below the SMA 200D, so the death cross is already in place and the long-term trend is down. The EMA 21 has been below the EMA 55 throughout the table.
- Possible bullish divergence (short-term): MACD and RSI held up better than price on the Nov 5 low (price made a new low at about $5.63, while MACD only dipped to -0.414). The Nov 6 rebound back above $6.3 produced a long-tailed reversal candle. This is a mild, unconfirmed positive.
- CMF trend: Rising from deeply negative to flat, so distribution is easing. It is still not a buy signal.
- ADX: Rising since early October, which confirms the downtrend. +DI at 10 shows almost no bullish participation.
- Resistance cluster: The MA stack overhead ($6.72 EMA 21, $6.55 BB mid, $7.15 BB upper) is likely to cap any bounce.
CHART PATTERNS
- Bearish continuation (flag/pennant-style range): From Oct 20 to Nov 4, price consolidated sideways in a tight $6.3–$6.9 range after the sharp early-October drop. This resembles the Bearish Flag/Pennant from the reference diagram.
- Breakdown and rejection: Price broke below the range on Nov 5 to about $5.63, then reversed back into it on Nov 6. This looks like a failed breakdown or bear trap, so the pattern is ambiguous.
- Targets: A measured-move projection of the breakdown suggests lower levels (below $5.63), but the Nov 6 recovery delays that. Range support is at $6.30, with $5.63 as the last swing low.
- Overall: The structure is a persistent downtrend with lower highs. A close above $6.90 would invalidate the bearish flag.
POTENTIAL SCENARIOS
- Scenario 1: Bearish Trend Continuation — The bounce fades into the falling EMA 21 and the strong downtrend (ADX 34, −DI dominant) resumes, with a retest of the Nov 5 low zone. Trigger: rejection at $6.55–$6.72 and a daily close below $6.20. Target: $5.70–$5.95 (lower Bollinger Band area), possibly a drift toward $5.60. Invalidation: daily close above $6.90. (50% probability)
- Scenario 2: Bullish Relief Rally — The Nov 5 capitulation low holds, the reversal candle follows through, and CMF turns positive and MACD crosses up. Price rallies to the moving-average cluster. Trigger: close above $6.72 (EMA 21) on rising volume. Target: $7.15 (upper Bollinger Band), up to $7.50 (EMA 55). Invalidation: close below $5.95. (30% probability)
- Scenario 3: Neutral Range Consolidation — Price chops between $5.90 and $6.70 as selling exhausts and buyers fail to take control. Trigger: no clean break of either $5.95 or $6.72. Target: $6.20–$6.50. Invalidation: a close outside the $5.90–$6.75 range. (20% probability)
PRICE TARGETS
- Target Price: $6.05 (20-day horizon, Nov 28, 2026)
- Expected Range: $5.65 to $6.40. Width is $0.75, about 11.8% of the current price, which fits the 14–21 day guidance.
- Key Levels: Support at $5.63, Resistance at $6.72
OVERALL BIAS
OVERALL BIAS: BEARISH - Price is below every major moving average with a death cross in place. ADX is at 34 with −DI (30.9) far above +DI (10.3), and the EMA 21 at $6.72 is overhead resistance. Conviction is modest because of the Nov 5 capitulation reversal, rising CMF and flat MACD, which leave room for a relief bounce.
This is educational analysis and not financial advice.